
Executive Summary
Singapore’s real estate market is a tapestry woven with various economic and policy threads, each contributing to the overall picture. In 2023, the nation witnessed a noticeable slowdown in economic growth, with GDP expanding by a modest 0.7%. This deceleration, set against a backdrop of global challenges such as the US-China tensions and the Israel-Hamas conflict, has had a direct impact on the real estate landscape.
Inflation has been a key player in this narrative. The Monetary Authority of Singapore (MAS) expects the core inflation rate to average between 2.5% and 3.5% in 2024, a slight relief from the 4% experienced in 2023. This projection is not without its caveats, as the MAS warns of potential escalations due to global disruptions in food and energy, as well as unforeseen wage pressures.
A significant factor influencing the real estate sector has been the high interest rate environment, a consequence of the US Federal Reserve’s aggressive stance in combating inflation. Singapore, being highly responsive to international economic conditions, felt the ripple effects in the form of increased mortgage rates. However, there’s a glimmer of hope on the horizon as the US is expected to loosen its monetary policy in 2024, potentially leading to more favourable borrowing conditions in Singapore.
The domestic scene shows a promising trend in terms of household debt and income. The reduction in overall household debt to its lowest level in over a decade, coupled with a robust growth in the median monthly income of residents, paints a picture of financial stability and prudence.
The government’s policies have been pivotal in shaping the real estate market. The introduction of a new HDB classification framework, effective from the second half of 2024, is a game-changer. This reclassification, designed to better reflect the development status of various townships, aims to encourage the purchase of flats for long-term living rather than short-term investment gains. This policy shift is expected to alter application patterns in BTO sales and impact the resale market.
As we move into 2024, the Singapore real estate market stands at a crossroads, influenced by global economic shifts and local policy changes. The market has shown resilience in the face of rising interest rates and economic slowdown. However, the true test lies ahead, as it navigates through the anticipated changes in US monetary policy and adapts to the evolving housing landscape. The role of MAS in responding to these global and local dynamics will be crucial in ensuring a stable and conducive environment for the real estate sector. In essence, the market is characterised by cautious optimism, with a focus on long-term stability and sustainability.
Foreword by Melvin Lim
CEO, Co-founder PropertyLimBrothers (PLB)
As we navigate through the intricate and ever-evolving real estate landscape of Singapore, our commitment at PropertyLimBrothers to provide insightful and actionable intelligence to our stakeholders remains steadfast. This report, meticulously crafted, sheds light on the multifaceted dynamics of our market as we transition from 2023 into 2024, a period marked by economic recalibrations and policy shifts.
The past year has undeniably been a period of economic moderation for Singapore, with GDP growth slowing to a modest 0.7%. This deceleration, set against the global backdrop of geopolitical tensions and economic uncertainties, has had a profound impact on our real estate sector. Yet, in these challenges, we also find resilience and opportunities for growth and adaptation.
Inflation and interest rates have been at the forefront of our market’s narrative. With the core inflation rate expected to stabilise in the coming year, and the Monetary Authority of Singapore (MAS) projecting a balanced approach to economic stewardship, we anticipate a period of cautious optimism. The anticipated easing of US monetary policy in 2024 may also usher in more favourable borrowing conditions, which could bode well for our real estate market.
At PropertyLimBrothers, we believe that buyers and sellers should have happiness in their households when making property decisions more than anything else. After all, behind every home is a family.
A key highlight of this period is the remarkable reduction in overall household debt – a testament to the financial prudence of Singaporeans. Coupled with a significant rise in median monthly income, this trend speaks volumes about the stability and maturity of our market participants.
The government’s introduction of a new HDB classification framework is a pivotal development, marking a shift in how we view and engage with public housing. This reclassification aims to balance the aspirations of homeowners with the broader goal of maintaining a stable and sustainable housing market. It’s a move that aligns well with our ethos at PropertyLimBrothers – where we view real estate not just as a transaction, but as a key part of life’s journey.
As we step into 2024, we are cognizant of the challenges and opportunities that lie ahead. This report is designed to equip you with the knowledge and insights to navigate these times. At PropertyLimBrothers, we remain committed to guiding our clients and partners through these dynamic times with expertise, integrity, and a deep understanding of the nuances of our market.
I hope you find this quarterly report, prepared by our Research and Editorial team, insightful and useful. And thank you for placing your trust in us, we look forward to continuing this journey together.
All the best, and take care.
Melvin Lim
CEO, Co-founder of PropertyLimBrothers
Methodology
The information presented in this report is primarily sourced from URA data, but may also incorporate data from other sources such as Squarefoot, Edgeprop, S&P Global, TradingEconomics, and Statista to complement it. In addition, we use data from reputable banks and consulting firms’ corporate reports as well as economic data from various government websites in Singapore, the United States, and other countries, including data from Central Banks worldwide.
Our report focuses on significant global macroeconomic trends and examines how they could impact Singapore’s real estate market, taking into account changes in monetary policy and growth projections. We carefully consider both demand and supply factors in Singapore’s property market and use a combination of macro and micro conditions to provide an in-depth analysis. Based on our assessment, we offer our perspective on the likely performance of the real estate market in the upcoming quarters.
The micro analysis primarily focuses on examining price and volume movements within the real estate market. To identify any disparities in the performance of various market segments, we utilise a non-parametric subsampling method. We obtain performance data from URA and then create sub-samples for analysis, which are divided based on factors such as property type, size, location, and other characteristics. The approach we use is mainly descriptive in nature, but we also incorporate some qualitative analysis and comments on consumer sentiment and behaviour.
This Q3 report builds on the previous reports, which highlighted the potential impact of the high interest rate environment and latest government intervention in the form of ABSD cooling measures and Government Land Sales (GLS) supply on Singapore’s real estate market.
Contents
Macro
- Slowing Economic Outlook Amid Growing Inflation
- High Interest Rate Environment & Anticipated Rate Cuts
- Changes in Government Policy – Potential Ripple Effects
Micro
- Quarterly Growth in Residential Real Estate Segments
- Quarterly Growth in Commercial Real Estate Segments
- In Focus — Opportunity Spaces Based On Q3 Data
Slowing Economic Outlook Amid Growing Inflation
In 2023, the pace of Singapore’s economic growth has notably decelerated compared to the robust annual GDP increase of 3.6% witnessed in 2022. The decline in economic growth has been primarily attributed to a decrease in manufacturing output and exports, due to weaker global demand for goods exports.
However, amidst global challenges, Singapore’s economic landscape showed resilience, registering a modest growth of 0.7% from the third quarter of 2022 to the same period in 2023. This growth occurred against a complex backdrop marked by a deceleration in China’s economic activities and heightened tensions between major global powers, specifically the US and China. The recent Israel-Hamas conflict is also likely to add layers of complexity to the already uncertain global economic environment.
Moving into 2024, the global economic landscape will likely grapple with significant challenges, including a steeper deceleration in China’s economy, enduring high inflation, and more stringent financial environments.

In its latest forecast, the Monetary Authority of Singapore (MAS) has projected that Singapore’s core inflation rate, which excludes costs related to accommodation and private transport, is expected to average between 2.5% and 3.5% in 2024. This comes after 2023 closes with core inflation averaging around 4%, and all-items headline inflation reaching approximately 5%.
For the first quarter of 2024, MAS anticipates a slight increase in core inflation. This uptick is attributed to the planned Goods and Services Tax (GST) hike effective from 1 January 2024, coupled with rising costs in water, electricity, and public transport. Despite this initial rise, the overall trend for core inflation is expected to gradually moderate throughout the year.
However, MAS cautions that there are still risks of inflation escalating, particularly due to potential global disruptions in food and energy commodities, as well as unforeseen increases in wage pressures. On the other hand, a faster-than-expected slowdown in global economic activity could lead to a more rapid easing of inflation rates.

The latest Financial Stability Review by the MAS also indicated a continued reduction in overall household debt for the eighth consecutive quarter, reaching a level of 1.2 times the personal disposable income by the third quarter of 2023. This figure is the lowest in over a decade. A key factor contributing to this decline is the cautious stance adopted by households regarding new loan commitments, especially in the real estate sector, in the context of escalating interest rates that have been prevalent since the second half of 2022.

Another factor contributing to the decline in overall household debt could also be attributed to the increase in gross median monthly income of full-time employed residents in Singapore. According to data retrieved up to 1 Dec 2023, gross median monthly income has grown by almost 14% since 2019.
The observed trend of low household debt could signify a tempered interest in new mortgages and housing loans. This trend suggests a more stable property market but also points to a potential slowdown in property transactions, a pattern that has become evident towards the end of this year and throughout 2023. Furthermore, this could lead to more sustainable property prices, as it indicates buyers are not excessively borrowing to finance property purchases, thereby reducing the demand for housing and possibly affecting property values.
Developers, noting households’ increased reluctance to take on debt, might also reassess their plans for future projects and property launches. While low household debt is largely seen as a positive sign, there is a concern that excessively low levels could hinder economic growth. Adequate borrowing is often vital for economic expansion, particularly in the real estate sector, where mortgage financing plays a pivotal role in facilitating property transactions.
These latest insights highlight Singapore’s economic fortitude, marked by a notable decrease in household debt. This reduction is attributed to cautious financial practices in the face of increasing interest rates, supported by strong income growth. In the real estate domain, which accounts for a substantial part of household debt, there is evident stability characterised by moderate growth in loans and successful implementation of risk management strategies. Although this trend of low household debt indicates a healthier property market, it’s important to remain vigilant as overly low levels of borrowing could potentially hinder economic development.
High Interest Rate Environment & Anticipated Rate Cuts

In Q3 2023, the Federal Open Market Committee (FOMC) continued to combat soaring inflation with its aggressive stance on monetary policy, a key aspect impacting global economic trends including the real estate sector in Singapore. During their July meeting, the FOMC raised the federal funds rate by 25 basis points (0.25%), bringing the upper range of this rate to 5.50%. This move marked the continuation of a significant tightening cycle that began in March 2022, with the Federal Reserve (Fed) incrementally increasing interest rates by a total of 5.25% – one of the most rapid escalations in U.S. history.

In their latest Summary of Economic Projections (SEP), the FOMC revealed expectations for one more rate hike within the year, to be followed by a reduction in rates by 50 basis points down to 5.1% in 2024. Current market forecasts are in line with this projection, estimating a 50% likelihood of a further rate increase this year and anticipating a 50 basis point cut in 2024.

For Singapore, these developments in U.S. monetary policy could significantly influence the real estate market. As a highly open economy, Singapore’s financial and real estate sectors are responsive to international economic conditions. The Fed’s rate hikes have led to higher borrowing costs globally, including in Singapore. This has resulted in increased mortgage rates, impacting both property buyers and investors.


The anticipated loosening of U.S. monetary policy in 2024 might bring some relief, potentially leading to more favourable borrowing conditions in Singapore as well. However, the interim period of high interest rates could dampen real estate market activity, with buyers and investors becoming more cautious due to higher financing costs.
Therefore, it is crucial to assess how these global monetary policies might shape the real estate landscape in Singapore. Potential investors and stakeholders in the Singapore property market should be aware of these international trends and their possible implications on local real estate prices, mortgage rates, and overall market sentiment. The responsiveness of the Monetary Authority of Singapore (MAS) to these international monetary shifts will be pivotal in maintaining a stable and conducive environment for the real estate sector amidst global economic fluctuations.

Changes in Government Policy – Potential Ripple Effects
In this segment, we discuss the recent changes in government policy – specifically the new housing measures that will reshape the future of the real estate market in Singapore.
New HDB Classification Framework
During the National Day Rally 2023, Prime Minister Lee Hsien Loong announced a new HDB classification framework that will be taking effect from the second half of 2024. According to PM Lee, the current classification framework of mature and non-mature towns no longer accurately categorises the various BTO projects across Singapore as many townships have gotten much more developed over time. To replace this framework, the government will be introducing a new category of flats – Plus model, which will accompany the Standard model and the existing Prime model (also known as Prime Location Housing or PLH model).
This reclassification also serves to reframe BTO flats as homes instead of investments, part of the government’s efforts to ensure that applicants applying for these flats are purchasing them for their own long-term stay rather than to flip it for profits. Since the introduction of the PLH model in 2021, demand for BTO projects in prime locations such as Bukit Merah, Kallang/Whampoa, and Queenstown, has been tapered. However, BTO projects with strong locational attributes that did not fall under the PLH model continued seeing high demand. The introduction of the Plus model allows HDB to further taper the demand, mitigate the lottery effect, and ensure a good social mix – while keeping the system fair for all income groups.
Potential Ripple Effects

The first ripple effect that we might see is the shift in application pattern in the BTO sales exercises that happen four times a year. When the new classification framework takes effect in the second half of 2024, those with the intention to flip their BTO flat for profit will be further discouraged from applying for Plus and Prime flats in choicer locations as they will not risk the long waiting time of at least 13 years (an average of 3 years for the construction on top of the 10-year MOP). Future BTO sales exercises could see more applicants who have aspirations for asset progression leaning towards Standard flats, since they do not come with tight restrictions. In fact, those who still harbour the dream of owning more than one property will be applying for Standard flats as they can be fully rented out upon MOP.

Plus and Prime flats are set to hit the resale market around 13 to 14 years later. Calculations based on the $14,000 income ceiling cap for these flats, considering the current Mortgage Servicing Ratio (MSR) and Total Debt Servicing Ratio (TDSR), indicate that buyers can afford flats priced at approximately $1.1M with an HDB loan and around $1M with a bank loan. However, factoring in future inflation, it’s anticipated that the buyer market for these flats will be relatively small. Additionally, there will be a subsidy clawback upon their resale, suggesting that the cash returns could be comparable to Standard flats, with the primary difference being the resale period.
The updated policy framework strongly advises homeowners to consider Plus and Prime flats mainly for long-term living rather than short-term investment. Those looking to sell their flats shortly after meeting the MOP for an upgrade should focus on Standard flats or explore the resale market.
The retrospective nature of this reclassification, affecting only projects launching post-second half of 2024, means existing projects with highly desirable locational attributes like Central Weave at Ang Mo Kio, won’t face these stringent measures. This exemption is expected to boost demand for flats in such projects, especially given their locations near amenities in the town centre and an MRT station. The government’s recent increase in grants for resale flat buyers further enhances the appeal of resale flats. In the short term, this could lead to a spike in prices, particularly for resale flats near MRT stations and town centres, in response to increased demand.

Quarterly Growth in Residential Real Estate Segments
In this section, we examine residential real estate segments. This refers to resale HDBs, ECs, Condominiums, Apartments, and Landed properties including Pure Landed and Strata Landed. The percentage values refer to the quarter-on-quarter change in Total Transaction Value (TTV), and the colour gradient of the boxes are based on the percentage change from Q2 2023 to Q3 2023. The size of the boxes refers to the relative TTV to other segments, which tells us which segments have the most ‘activity’ in terms of value being transacted. It is also important to note that some districts are excluded from the heatmaps due to insufficient data or low transaction volume.
Resale HDB

For the resale HDB subgroup, the mostly-green heat map suggests that transaction activity has picked up compared to the previous quarter. Planning areas that saw the highest growth in TTV from Q2 2023 to Q3 2023 include Bukit Timah (+78%), Serangoon (+67%), and Jurong East (+44%). The top 5 segments with the highest transacted value remain to be Punggol, Sengkang, Woodlands, Tampines, and Yishun – with the transacted value of Tampines surpassing that of Yishun’s this quarter. Jurong West and Bukit Merah also saw a significant growth in TTV, recording a growth rate of 28% and 21% respectively.
Punggol and Sengkang continue to be the segments with the highest transaction activity, coming in with just over 1,000 transactions combined. It is worth noting that both segments experienced a dip in TTV from the previous quarter, but strong performances from Hougang (+12%) and Serangoon (+67%) indicate a healthy growth and appreciation potential in District 19 as a whole, especially as we move towards the completion of the Punggol Digital District in 2026.
Executive Condominium

In the Executive Condominium (EC) subgroup, the quarterly growth numbers based on TTV predominantly point to a high upside. The quarterly growth in TTV ranges from -5% to +224%, with the range mostly on the positive side. District 23 (Bukit Panjang, Choa Chu Kang), District 27 (Sembawang, Yishun), and District 19 (Punggol, Sengkang) once again come out as the top 3 districts with the highest TTV.
District 23 continues its stellar run as it records yet another 224% growth in TTV (the segment with the highest TTV growth in Q3 2023) with a total transaction value of $653 million – more than triple of last quarter’s record of $202 million. This comes on the back of Sol Acres achieving its MOP this year, allowing its units to hit the resale market for Singaporeans and Permanent Residents (PRs). As a mega development and the largest development in Choa Chu Kang, the average PSF of Sol Acres has grown by almost 80% since its launch in 2014. The launch of Altura EC in the Bukit Batok area of District 23 in August could have contributed to the high transaction activity and TTV as well.
District 18 (Pasir Ris, Tampines) also saw a decent 49% growth in TTV, a testament of the strong demand for ECs in the area which will see upcoming Cross Island Line (CRL) interchanges at Tampines North and Pasir Ris MRT stations.
Apartment & Condominium

Prices of private non-landed properties increased by 2.2% in Q3 2023, compared with the 0.6% decrease in the previous quarter. Breaking it down by region, private non-landed property prices in the Core Central Region (CCR) fell by 2.7% in Q3 2023, a sharper drop than the 0.1% seen in the previous quarter. Conversely, in the Rest of Central Region (RCR), prices rose by 2.1%, rebounding from a 2.5% decline. Meanwhile, the Outside Central Region (OCR) saw a significant 5.5% increase in prices, up from a 1.2% rise in the prior quarter.

Looking at the Apartment & Condominium subgroup, the mostly-red heat map is consistent with URA’s real estate statistics for Q3 2023 showing that sale transaction volume for private non-landed properties had dropped by a significant 15% QoQ and 26% YoY. The growth rate of TTV this quarter ranges from -63% to +1,098%, but the change in transaction value compared to the previous quarter is rather marginal for most segments. The districts with the highest TTV are District 15 (Marine Parade, Katong), District 10 (Bukit Timah, Holland Village), and District 26 (Upper Thomson, Lentor).

District 15 continues to dominate as the segment with the highest transaction value and activity, on the back of several high-profile new launches such as Tembusu Grand, Grand Dunman, and The Continuum. Despite its TTV growing by only 3% from the previous quarter, District 15 saw a whopping 905 transactions in Q3 2023. In that same vein, District 26 was also a standout segment, experiencing a massive 1,098% increase in TTV and recording 425 transactions in this quarter. This performance can be largely attributed to the successful launch of Lentor Hill Residences, which sold about 50% or 298 of its 598 units on its launch weekend.
Pure Landed

Coming to the Pure Landed subgroup, the mostly-green heat map reflects that transaction activity has picked up again across different segments as compared to the previous quarter. The growth rate of TTV ranges from -35% to +114%, with the range mostly on the positive side.
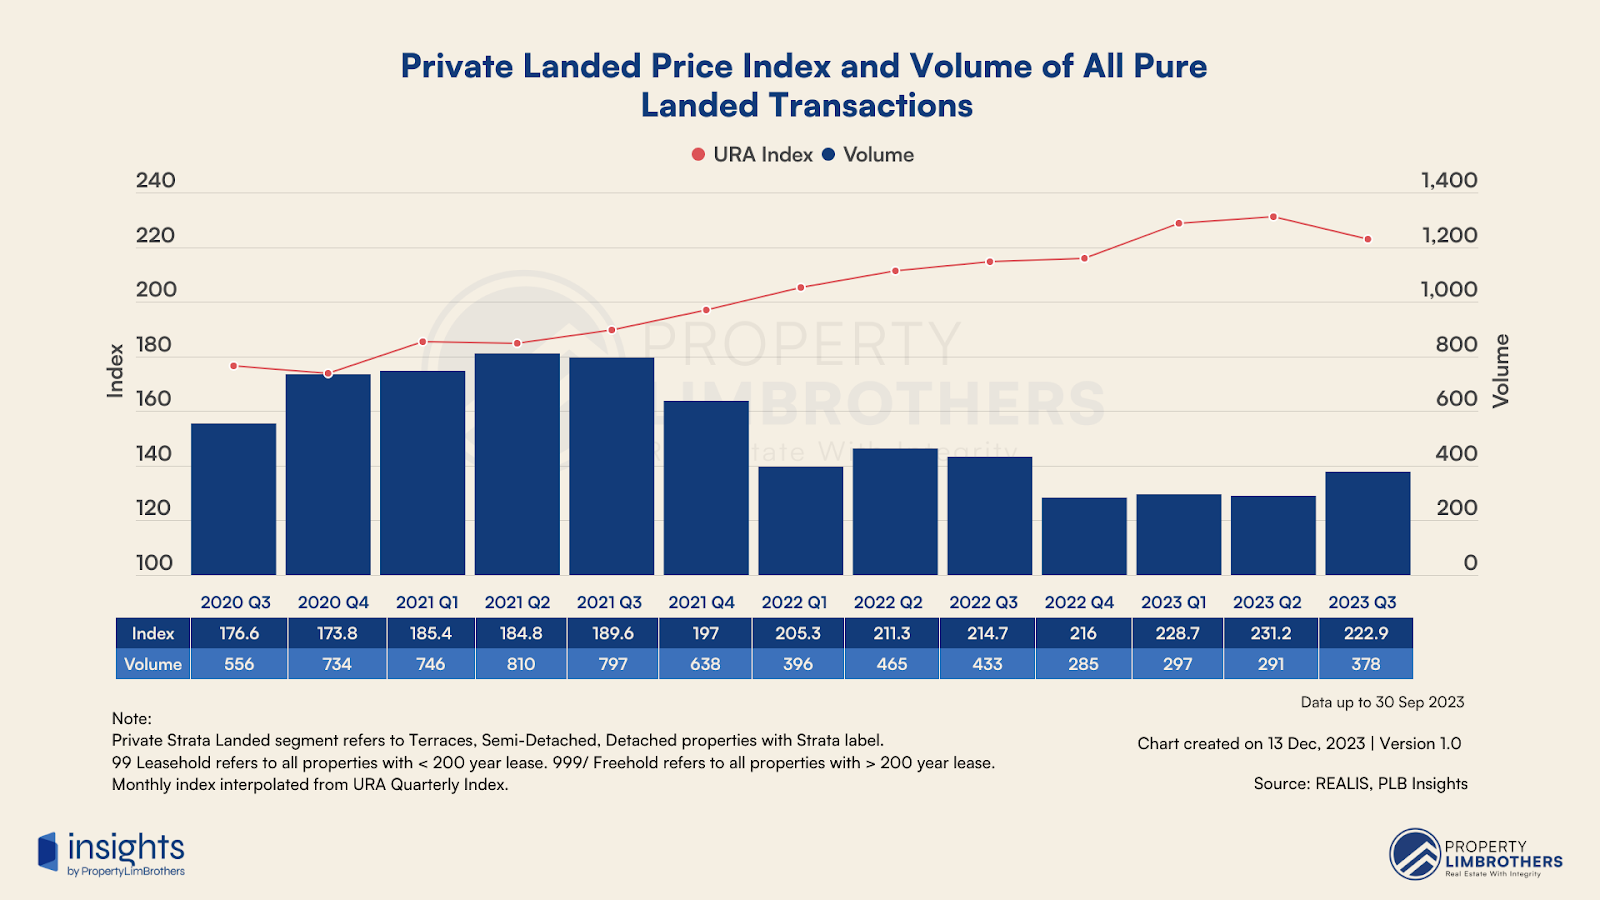
Despite the healthy TTV growth in the pure landed subgroup, prices of landed properties decreased by 3.6% in Q3 2023, reversing the 1.1% increase in the previous quarter. We previously wrote an article addressing the decline of the landed price index based on URA’s Q3 flash estimates. Digging deeper into the underlying factors contributing to this decline, we uncovered a significant drop in median transacted price of detached houses – and specifically the significant decrease in the average PSF of detached houses in Districts 10 and 11 which accounts for 57% of the entire detached house market.
Although the average PSF of detached houses in Districts 10 and 11 have come down, the segments as a whole are still performing well based on their TTV. Districts 10 and 11 recorded an 11% and 53% TTV growth respectively compared to the previous quarter, combining for a total of 56 transactions. This could indicate an opportunity space for buyers to hunt for a good entry into these segments.
District 19, ranked third last quarter in terms of its TTV, has grown by 32% in terms of TTV and has the highest TTV in Q3 2023. Looking at the numbers, District 19 recorded a total of 62 transactions amounting to $290 million in transacted value compared to District 11 that recorded $266 million in transacted value with just 25 transactions. This disparity indicates the price differential of District 19 pure landed properties as compared to District 11’s.
Strata Landed
In the Strata Landed subgroup, due to the low transaction volume, we were not able to draw any meaningful insights this quarter. We will continue to monitor the subgroup in the coming quarters for any movements in transaction activity.
Quarterly Growth in Commercial Real Estate Segments
In this section, we examine commercial real estate segments. This refers to commercial offices, shophouses, and retail shops. With the ABSD rate for foreigners doubled to 60%, foreign investors might be looking towards non-residential segments such as commercial and industrial properties to avoid the hefty tax. We look at the transaction activity in the commercial space to get a general idea of how the segment is doing.
The percentage values in the charts refer to the quarter-on-quarter change in Total Transaction Value (TTV), and the colour gradient of the boxes are based on the percentage change compared to the previous quarter. The size of the boxes refers to the relative TTV to other segments, which tells us which segments have the most ‘activity’ in terms of value being transacted.
One caveat to note here is that for commercial properties, many businesses choose to rent for their operations rather than to buy and pay hefty overheads to maintain a property. Therefore the transaction activity is typically low and trends can be volatile.
Commercial Office

For the Commercial Office subgroup, the transaction heat map shows a quarterly growth range of -74% to +326%. The largest segment remains to be District 1 Central Business District (CBD), despite its TTV experiencing a 31% decline compared to the previous quarter. Although it is the biggest segment in the subgroup, there were only 13 transactions in Q3 2023 translating to a transacted value of $166 million, which reflects the nature of commercial office spaces in Singapore.
District 19 recorded the highest growth in TTV this quarter, which could be a positive sign for the government’s efforts to decentralise the CBD with upcoming transformations such as the Punggol Digital District. Districts 9 (Orchard, River Valley), 15 (Marine Parade, Katong), 22 (Boon Lay, Jurong, Tuas), and 25 (Admiralty, Woodlands) all had a positive TTV growth of over 100% compared to the previous quarter, but seeing as they combine for only 24 transactions, the trend is likely to be volatile and could fluctuate in the coming quarters. Two of these districts, 22 and 25, are also where major transformations are happening – the Jurong Lake and Jurong Innovation District, as well as the Woodlands Regional Centre. These upcoming transformations are part of the government’s effort to decentralise the CBD and will generate more commercial activities in the OCR in the future.
Commercial Shophouse
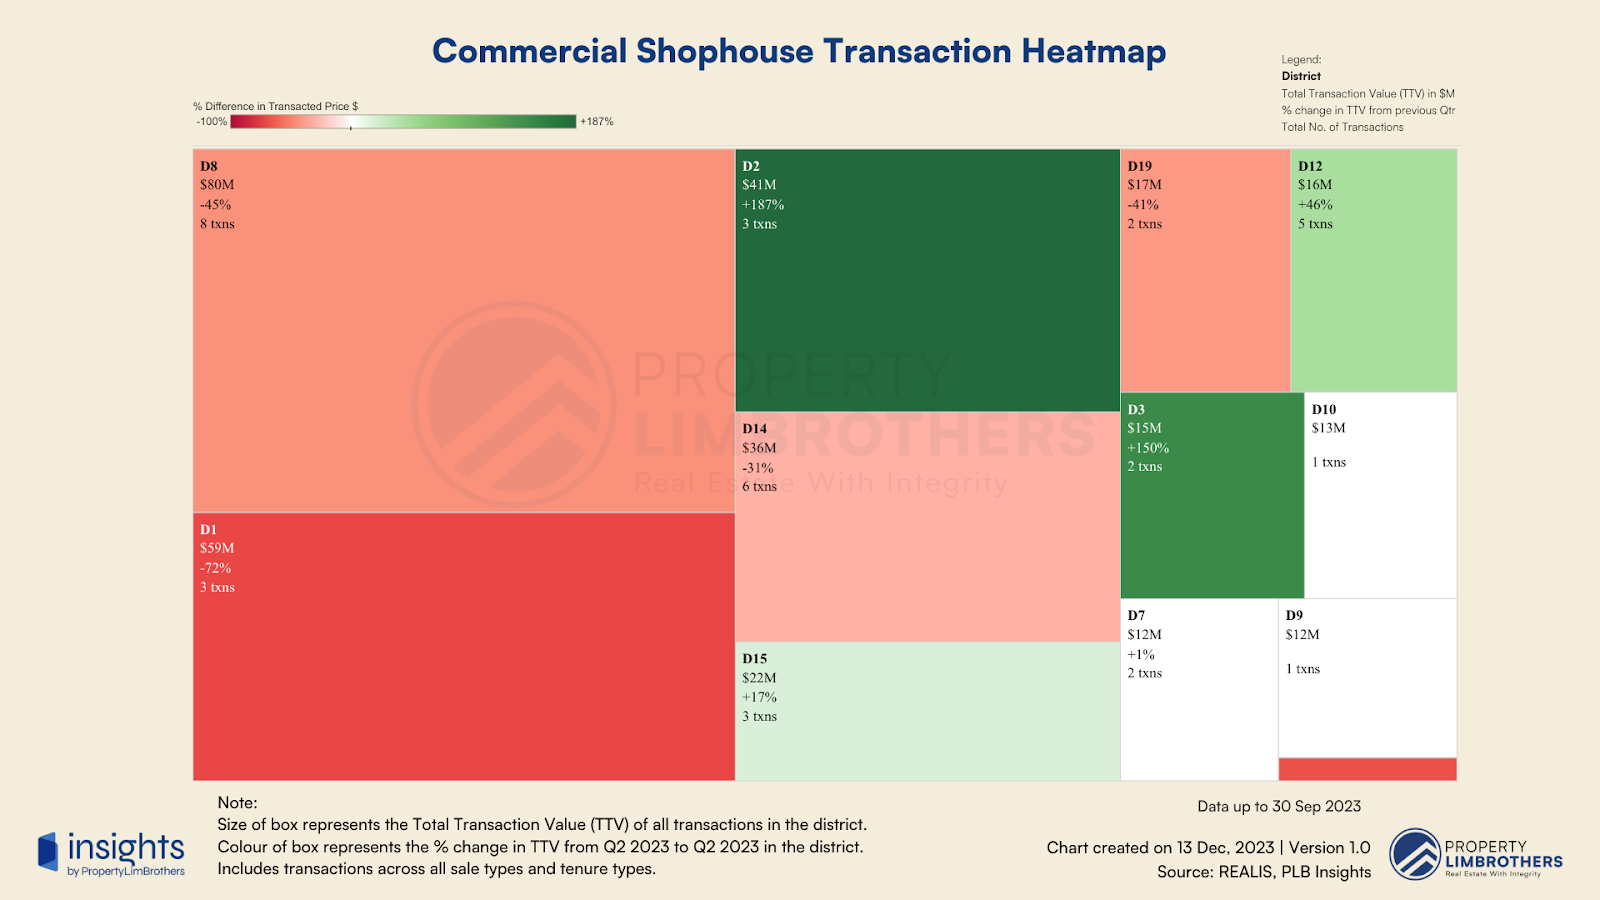
Coming to the Commercial Shophouse subgroup, the quarterly growth numbers indicate that transaction activity has dropped, reversing the growth in TTV the previous quarter. The quarterly growth ranges from -72% to +187%, with the range mostly on the negative side. However, this does not mean that prices will start falling in tandem since Shophouses have always been the best performing segment among commercial real estate due to its limited supply and historical value. This decline in transaction activity across the segments is likely due to a lack of supply given that most owners are likely holding on to them or renting them out.
After District 1 (CBD) surpassed District 8 (Farrer Park, Serangoon Road) in total transacted value and transaction volume last quarter, the tables have turned again in Q3 2023. Looking closer at the numbers, both districts saw a dip in transaction activity – so the reversal of TTV ranking was due to a sharper decline in transaction activity in District 1 compared to District 8.
Commercial Retail

Lastly, the Commercial Retail subgroup shows a quarterly TTV growth range of -67% to +20,845%. Retail spaces are typically rented from larger mall operators such as CapitaLand and Far East Organisation, which explains the low transaction volume and activity every quarter. The inflated TTV growth rate for District 16 (Bedok, Upper East Coast) is due to 4 transactions that amounted to a transacted value of $339 million, compared to the previous quarter where it only had 3 transactions that amounted to $1.6 million. The 4 transactions in District 16 this quarter include 3 transactions in East Village amounting to about $1.4 million and the sale of Changi City Point by Frasers Centrepoint Trust which amounted to $338 million.
In Focus — Opportunity Spaces Based On Q3 Data
As we await some reprieve from the high interest rate environment, the role of real estate as a potential safeguard in uncertain economic times is increasingly coming to the fore. However, it’s important to note that the performance of real estate as an investment can vary widely, influenced by factors such as property type and location. With the growing global economic uncertainty, these disparities are likely to become more pronounced. For market participants, it is advisable to closely examine the residential market segment. With that said, this section should not be seen as a buy or sell recommendation. Instead, we highlight areas that are worth looking into, taking into account individual investment goals and the nuances of specific projects.
| Opportunity Spaces for Sellers | |
| Category | Area |
| Resale HDBs | Punggol, Sengkang, and Jurong West |
| Executive Condominiums (EC) | Districts 23, 27, and 19 |
| Apartments and Condominiums | Districts 15, 26, and 19 |
| Pure Landed | Districts 19, 15, and 20 |
| Opportunity Spaces for Buyers | |
| Category | Area |
| Resale HDBs | Sengkang, Serangoon, and Jurong West |
| Executive Condominiums (EC) | Districts 23, 27, and 18 |
| Apartments and Condominiums | Districts 26, 22, and 23 |
| Pure Landed | Districts 16, 17, 11, and 19 |
Caveats & Disclaimers
The analysis and conclusions presented in our report are based on the data provided by the sources we have used. Therefore, the accuracy and reliability of our report depend on the integrity of the data provided by these sources.
The information contained in this report should not be construed as financial or real estate advice. It is recommended that you conduct your own thorough research and analysis before making any financial commitments or property decisions. It is essential to consult with qualified professionals to ensure that you have a comprehensive understanding of your financial situation and that your decisions are aligned with your best interests.
If you are interested in connecting with our team of real estate experts, please don’t hesitate to reach out to us. We would be delighted to engage with you on a deeper level and explore how the insights presented in this report could be relevant to your specific property journey.


