.author-container {
display: flex;
align-items: center;
justify-content: center;
}
.author-container img {
width: 110px;
height: 110px;
}
.author-profile {
flex-basis: auto;
}
.author-info {
font-size: 20px;
font-weight: 600;
line-height:200%;
}
.horizontal-line {
background: #123b7b;
width: 130%;
height: 6px;
}
@media screen and (max-width: 768px) {
.author-info {
font-size: 10px;
}
.horizontal-line {
width: 100%;
height: 3px;
}
.author-container img {
width: 80px;
height: 80px;
}
}


Executive Summary
The global economy is facing strong macro-headwinds. Since the start of 2022, financial markets have struggled to hold on to the gains from the post-pandemic recovery, which has been largely defined as K-shaped. This K-shaped recovery signals inequality in the recovery patterns of different aspects of the global economy. This pattern has percolated to Singapore’s real estate market as well. Growing inequality in the speeds of segment growth will be worsened by rising inflation and interest rates.
Residential properties and rentals have continued to rise through the pandemic and are now consolidating following the December 2021 cooling measures. On the other hand, commercial and industrial real estate has borne the brunt of the pandemic, declining significantly before recently finding support at the current price levels. With many macro-level events happening in 2022 Q1, we expect the rest of 2022 to reveal a less sharp K-shape with the recovery of commercial and industrial properties and a cooled residential property market.
In general, 2022 presents many challenges for investors with unfavourable macro conditions in the short-term. Investors would need to be more selective and cautious in their investment approach. This would mean active portfolio restructuring that prioritises lower volatility, defensive positions that can weather macro-headwinds. Investors should expect higher variance in returns between properties but lower volatility on aggregate in the residential property market. Commercial and industrial property investments offer higher risk premium for investors with a higher appetite for risk. At current price levels, these properties now offer better upside potential than their residential counterparts. However, value can still be found in specific segments of the residential property market.
Foreword by Melvin Lim
CEO, Co-founder PropertyLimBrothers (PLB)
Rain or Shine, PLB stands by our promise to our clients and prospects. From the very start, PLB’s business philosophy has been to focus on creating value for clients. We have been an advocate of virtual home viewings, digital marketing, home staging, data driven analytics, and client education through our own initiatives. Our aim from day one has been to deliver maximum customer value in order to win them over and see the light in the way we run our business.
“Every home has its own audience”
This guiding maxim has enabled us to keep the faith that property transactions — whether selling or buying — is all about finding the right match. We are focused on our staging and marketing efforts to polish up the story behind each home, in order to find its next owner. Despite the tough macro conditions, we are confident in our streamlined and sharp strategy. As the residential property market cools with the onset of new government policy, we believe that the value created by our approach would shine ever more brightly.
Another key thrust that PLB is pushing hard for is Technology. In order to overcome the complexity of property decision making, we have developed tools like our MOAT analysis to help clients make better decisions for their property journey. To find the hidden gems that fit their needs and still have room to appreciate despite the tight financial market.
We are driven to provide the top of class real estate education to our avid supporters and viewers. Every match starts with the individual. We hope that by educating our general client base and prospects, you will have a deeper understanding of the trends unfolding in the market. We have received great feedback from our attentive audience, and our Editorial team is driven to provide deeper and more organised insights following the findings from our quarterly reports.
Methodology
Our methodology is chiefly guided by URA data on caveats lodged coupled with the close monitoring of macroeconomic trends through corporate reports, professional analyst commentaries and policy decisions from relevant governments. We believe that staying connected to the ongoing discourse is necessary in order to have a holistic picture of the forces that are driving the changes we observe in Singapore’s real estate market.
We complement our macro outlook with microeconomic analysis on consumer sentiment based on performance data, disparity gaps across related property classes. Looking at the micro trends within each property segment allows us to see which of them are leading the market, and whether the laggards can offer any upside potential or decent risk premium.
Our analysis of performance data is driven by non-parametric subsample analysis. We take performance data from URA and proceed with creating subsamples for analysis. The samples are sliced by property type, size, and location. We rely heavily on descriptive statistics of the subsamples to identify patterns that suggest that the overall trend in the larger property market is driven by segment-specific growth.
The quarterly report is designed to identify the key macro and micro concerns to pay attention to over the course of the next quarter. Insights presented in this report will be further refined and explored over the next quarter through the work of PLB’s Editorial team.
Introduction
Singapore’s property market has proven to be resilient over the market. This is true for the residential properties that closed 2021 with a strong performance and held on to those gains throughout the first quarter of 2022. However, real estate performance has become increasingly segregated by property type since the pandemic.
Commercial and retail-specific properties have not been performing well over the course of the recovery period in 2020-2021. Nonetheless, some relief is found in 2022 Q1, as prices for commercial and retail-specific segments begin to consolidate, signalling a temporary bottom or a potential reversal in the coming quarters. With the Singaporean economy committed to living with the pandemic and moving towards a full reopening, we believe that it is the latter.
The rental market has picked up a solid upward trend. Given the current momentum of the price increase, it is unlikely that we have reached the peak despite extremely elevated prices. The timing of the rental market boom is likely due to the side effects of the pandemic, involving shifts in the nature of work, migratory demand, and changing personal needs. Expatriates being trapped in Singapore during the Global lockdown might have contributed to this boom. Increasing property prices also deter some homeowners that are trying to time the market, leading them to a temporary rental solution. Families renovating their existing properties and experiencing delays would also seek a rental solution.
This segregated performance pattern in the post-pandemic world is a perfect example of a K-shaped recovery. The residential property and rental market booms while commercial, retail-specific property slumps. Over the course of the 2022Q1 report, we will unpack the macroeconomic factors that might contribute to some of these trends and zoom into specific segments of Singapore’s property market to offer additional insights.
Global Macroeconomic Outlook
The global macroeconomic outlook in 2022 is generally dim. It presents challenges to investors in the form of heightened volatility and reduced returns across asset classes. This hostile investment environment is largely driven by inflationary pressures, monetary tightening and rising interest rates. Investors need to pay careful attention and cautiously navigate the waters in 2022. The tough macro outlook will likely exacerbate the K-shaped recovery in the markets, creating more disparity in the performance among asset classes.
Inflationary pressures have been the key macroeconomic challenge for countries around the world in 2022. This mainly results from loose monetary policy as a response to shelter the financial markets from the impact of pandemic lockdowns. Markets have seen stellar performance in 2020 and 2021 owing to dovish macro policy and pandemic stimuluses. The economy is showing symptoms of overheating in the U.S. and local Singaporean market. A combination of a tight labour market government stimulus packages will see a contribution to price growth in both wages and goods.
On top of the demand-pull inflation from the post-pandemic recovery, economies are now concurrently facing cost-push inflation from the Russia-Ukraine crisis. Sanctions on Russia coupled with supply chain disruptions for commodities are propping up prices for basic goods. Core inflation in Singapore has hit 2.9% in 2022Q1 and looks to trend higher, with rising energy and food costs mainly driving inflation in Singapore. The core inflation for the U.S. stands at 6.5%, U.K. at 5.5%, Canada at 5.5%, Australia at 3.7%, Germany at 3.4%, and South Korea at 3.3%.
Inflationary forces are here to stay for the short to mid term. Given the strong policy response to inflation, we might see inflation peak at the end of 2022. However, the persistence of high inflation is still a possibility even after peaking this year. The core focus should be to pay close attention to the demand-pull and cost-push factors for inflation as mentioned above. With cooler geopolitical climate and better investor confidence, economies might see better growth opportunities after the monetary tightening cycle ends.
In a bid to stall rising inflation, the U.S. Federal Open Market Committee (FOMC) has taken a hawkish stance on monetary policy, tightening monetary supply in the U.S. and reducing their balance sheets. It is the beginning of a new monetary tightening cycle and we will continue to see movement in various equity, bond, commodity and forex markets responding to the tightening policy. The Fed has put into place two main tools to deal with inflation in the U.S., mainly manipulating interest rates or their balance sheets to reduce monetary supply. This has global implications since the U.S. is still the heart of the global financial system.
Rising interest rates have been steadily increasing over the past two quarters. The Fed has recently announced on 4 May 2022 that interest rates will rise by 0.5%, the highest rate hike in 20 years. This is after they previously raised the interest rate by 0.25% on 16 March 2022. The interest rate might steadily increase at 0.5% intervals or take an even steeper climb depending on the inflation rate in the coming quarters. Should inflation continue to rise, interest rates will rise at a faster than expected rate, which might potentially shock the markets. We expect rates to continue rising for the next 5 FOMC meetings in 2022. This could put us at an interest rate of approximately 3 to 4% by the end of 2022, depending on the inflation numbers.
Analysts have commented on the late response of the FOMC to the inflationary concerns in the U.S., which may translate to a tougher and longer time battling it in 2022 and 2023. This raises a huge macro concern for investors. Investors must be prepared to deal with high interest rates and high inflation over the course of 2022, and perhaps 2023. This would likely trigger central banks around the world to take a similar hawkish stance in order to protect their local currencies and keep their inflation rates at bay.
The high interest rate environment has already driven the U.S. 30-year fixed rate mortgage average up, hitting 5.1% on 28 April 2022. This raises huge affordability concerns for property in the U.S. market. If the high interest rate environment is sustained on a global level, housing affordability will be a growing concern for 2022. The lack of housing ownership opportunities and options would mean fiercer demand in the rental market as consumers trickle down to more affordable housing options. If this trend continues to persist in countries around the world, socioeconomic concerns should be raised on capital and income inequality.
Moving forward to the Fed decisions on using their balance sheets to deal with an overheated economy, with a reduction of US$ 95 Billion per month. Financial markets will likely take the heat in the reduction of the balance sheet. The shrinkage will directly impact bond markets, leading to higher yields and lower bond prices. A key indicator we are paying attention to is U.S. yield curve inversions, which takes the 10 year minus 2 year treasury bond yield. The yield curve inverted briefly in the beginning of April 2022, signalling a potential recession in 2022.
This tough macroeconomic outlook will be reflected in the economic growth of nations and recessionary concerns going forward into Q2 and Q3. A recession is defined as two consecutive quarters of negative growth. The U.S economy shrank at 1.4% annualised rate, announced on 28 April 2022. That puts the U.S. economy at a heightened risk of a recession in the coming few months. With a tight labour market and shrinking availability of easy money, companies across the board in the U.S. will struggle with earnings and growth in 2022.
Thus far, the U.S. is the only major economy to put in a negative growth number in the first quarter of 2022. Other major economies still see an economic expansion going into 2022 but are facing deceleration and slashed growth estimates. Nonetheless, American and European economies seem to be more affected by inflationary pressures than their Asian counterparts. We expect China and Singapore to put in strong growth numbers despite these macro headwinds.
Based on the global macroeconomic outlook, we expect to see the post-pandemic K-shape disparity widen across countries, asset classes, and specific segments.
Singapore’s Property Market & Policy Impacts
The Singaporean property market has shown its resilience in the post-pandemic world. Property as an asset class in Singapore has grown a tremendous amount over the past two years. More specifically, we see the growth largely driven by specific segments of the market. We will cover these specific segments in the next section. This section will cover how the macro outlook trickles down to Singapore’s property market and the policy changes that will affect real estate the most.
Inflation has definitely infiltrated Singapore’s real estate market. Due to rising materials costs and consumer demand, both factors of inflation are in play for Singapore’s property market. Moving forward, we expect property prices to continue to rise despite additional cooling measures. This is due to rising costs for developers as well as strong consumer demand. The concern with property prices rising at the rapid pace is the development of a bubble and affordability issues. With price increase mainly driven by inflation, we believe that the development of a bubble forming in the property market is slim. Market conditions and cooling measures seem to be effective in keeping the lid on speculative demand. However, affordability will be a growing concern in the coming years.
This will be worsened by the rising interest rate environment, which will increase the income requirement in order to afford a home of the same price before mortgage rates take off. This will be a hurdle for HDB upgraders and Condo sellers. Even some existing owners who are about to refinance their loans may want to be careful in this macro environment. With harder-to-afford loans, luxury properties might see less entrants from the upper middle class and affluent foreign investors. This, however, may not be enough to deter local HNW/UHNW investors from piling into the luxury property market.
Growth in the property market has outperformed wage growth over the past few decades. We expect this trend to continue. Since the net demand for Singaporean land far outweighs the net demand for Singaporean human capital resources, prices will continue to outpace wage growth. This will worsen housing affordability for Singaporeans, especially those who are single or not married. HDB options are currently not available for these demographics under 35, and would likely have to resort to living with parents. The strong rental market as an alternative would also continue to rise as a result. This alternative could set back wealth accumulation significantly, adding to the K-shape disparity among different income groups in Singapore.
For investors who are currently exposed to Singapore’s property market, the higher rentals and rising property prices would likely be a welcome sight for their portfolios. We expect property to outperform other asset classes in an inflationary environment. However, rising interest rates can be a threat to rental yields and overleveraged individuals. Investors will have to pay close attention to their financing situation to make sure that they are not overstretched and risk insolvency.
This year presents some policies that tamper growth momentum in real estate. First, is the December 2021 Cooling Measures. This introduces higher ABSD for Singaporeans and PRs buying their second property and beyond, a lower TDSR threshold and a lower LTV limit for HDB loans. Second, is the increase in GST beginning in 2023 and 2024. From a policy viewpoint, the Cooling Measures are meant to keep growth sustainable in real estate, stabilise the market with less volatility. By keeping out speculative demand and keeping investors with holding power, the higher ABSD, lower TDSR and LTV, will help to deter buyers who are overstretching themselves to own a particular property.
The government would likely zoom in and keep a strong stance on affordable housing. There will be an increase in BTO supply in the coming years as well as a larger pipeline of residential releases. The coming years might see more redistribution policies come into play in the form of additional grants, ballot privileges, TDSR and LTV exemptions as possible policy options. The tax policy front will assist with this issue. With higher GST slated for the next two years, we can expect the Singaporean government to commit to reducing the K-shape disparity in so far as it is sustainable and cost-effective to do so.
The ABSD rules will keep the lid on specific investor demographics. These typically include HNW and UHNW investors, be it local or foreign. Higher ABSD discourages an extended decoupling strategy for multiple properties. The property portfolio strategy for these investors would likely be to diversify geographically or concentrate into larger purchases. Each strategy has its own benefits and pitfalls. These two strategies would likely see more play in HNW/UHNW property portfolios. In a separate upcoming report, we make our stand for a concentration strategy into larger quantum projects. Concentrating portfolios allow for consolidation of assets but require greater investment prudence in the selection of investments.
We expect to see the K-shaped disparity continue to widen or at least stay put at elevated prices for the rest of 2022 barring any additional cooling measures.
Segments of Singapore’s Real Estate Market
We break down segments of Singapore’s real estate market into the following groups:
-
HDB Flats
-
Executive Condominiums
-
Private Condominiums
-
Luxury Segment
-
Rental Market
-
Commercial & Industrial Properties
We segment by property type in order to find the subsample that is driving the growth we see in the overall market trend. The aim of the analysis is to get a better understanding of the property price movements and identify potential segments that will potentially continue to grow over the next few years. We further examine how price performance will defer by size and district to understand different cross-sections of the data. We look at performance data from January 2019 to March 2022 in quarterly format, covering 13 quarters in total.
HDB Flats
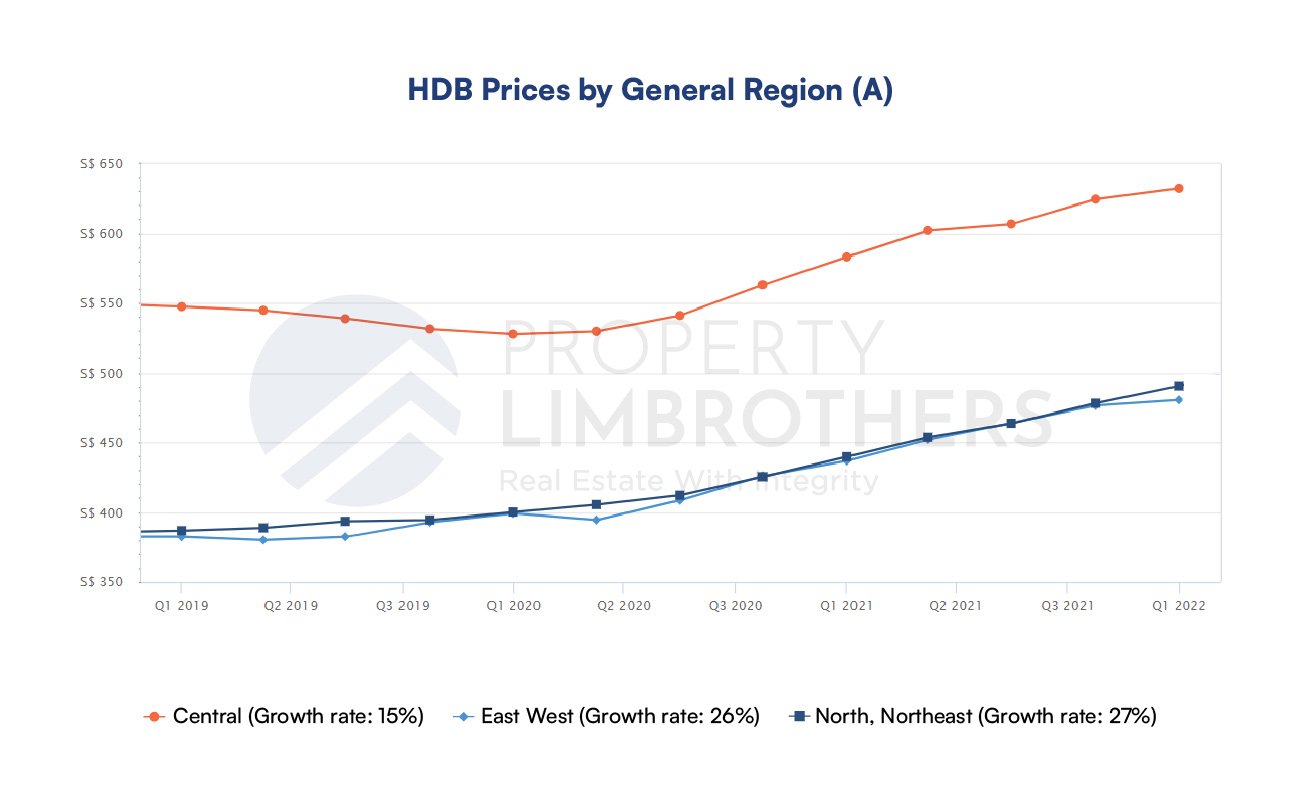
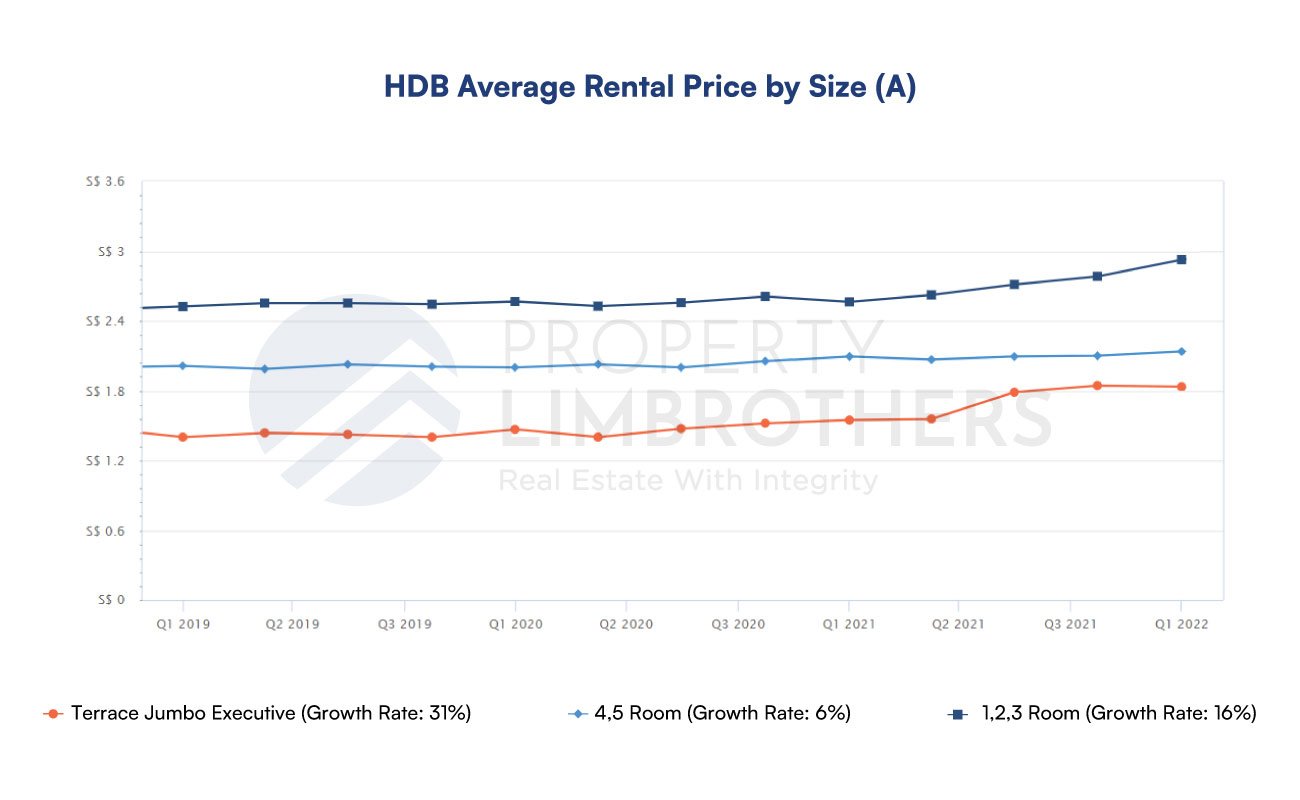
The aggregate price of HDB has risen an astonishing 22% since the pandemic. It is definitely a property type that has benefited from the K-shaped recovery. We further look at the breakdown by size and by general location in order to find out the segment driving the trend.

When looking at the HDB breakdown by size, we group the data in two different ways. Both of them show relatively close price performance by size with only a 4% difference at most between size groups. Terrace, Jumbo, and Executive HDBs show a 21% growth rate since 2019 and 2020 Q1. The 5-room flats also have the same growth rate but sell at a higher psf price.


Differences in performance seems to be largely due to location performance. HDB in the central area have the most elevated prices as compared to all other areas but have the lowest growth rate at 15%. On the other hand, the lower priced HDB (North area), grew 33% since 2019. This shows that HDB prices are starting to band together and consolidate in price, which is a sign of good health in the HDB market. This challenges some aged advice on property locations to “avoid the northern corridor”, which might not be applicable to buying HDBs. HDB prices outside of the central region are consolidating at a rapid pace over the past two years. We expect prices to stay tight throughout the year as the HDB market continues to heat up.

Executive Condominiums

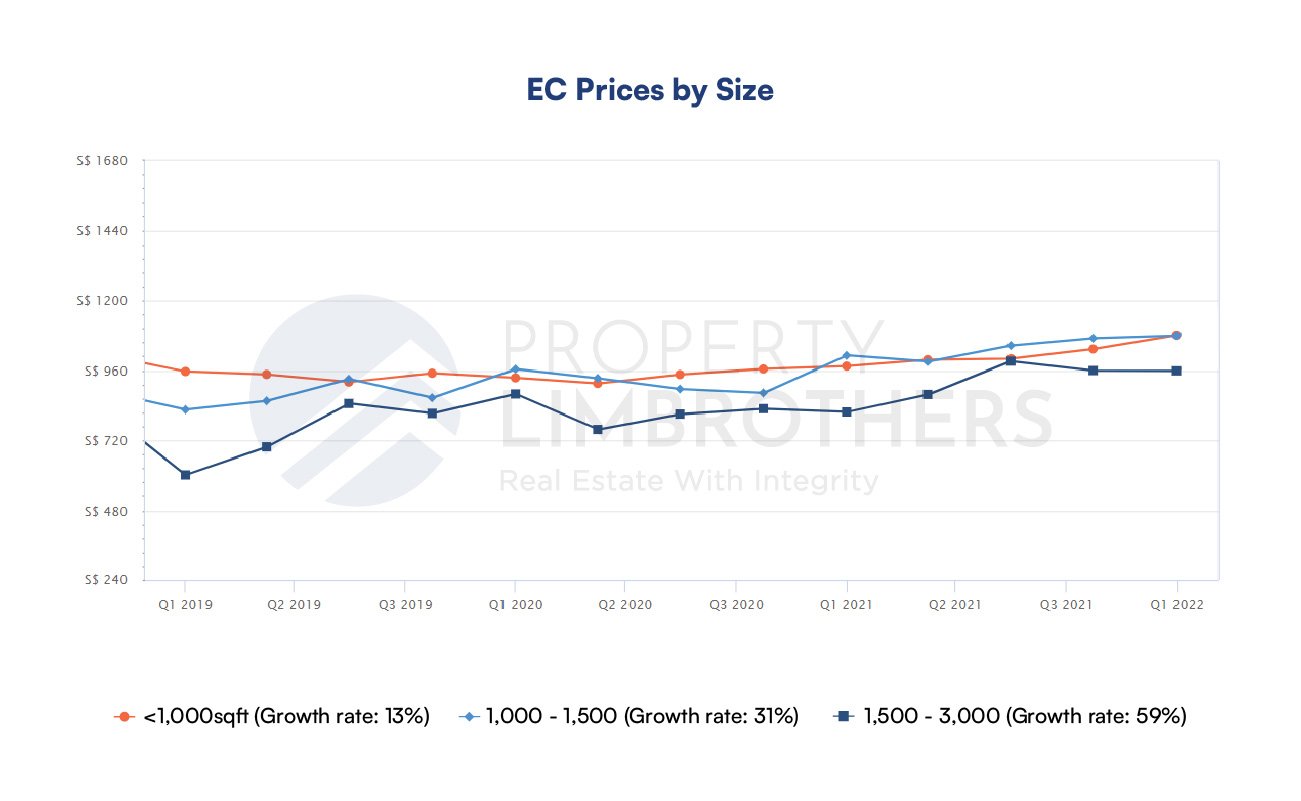
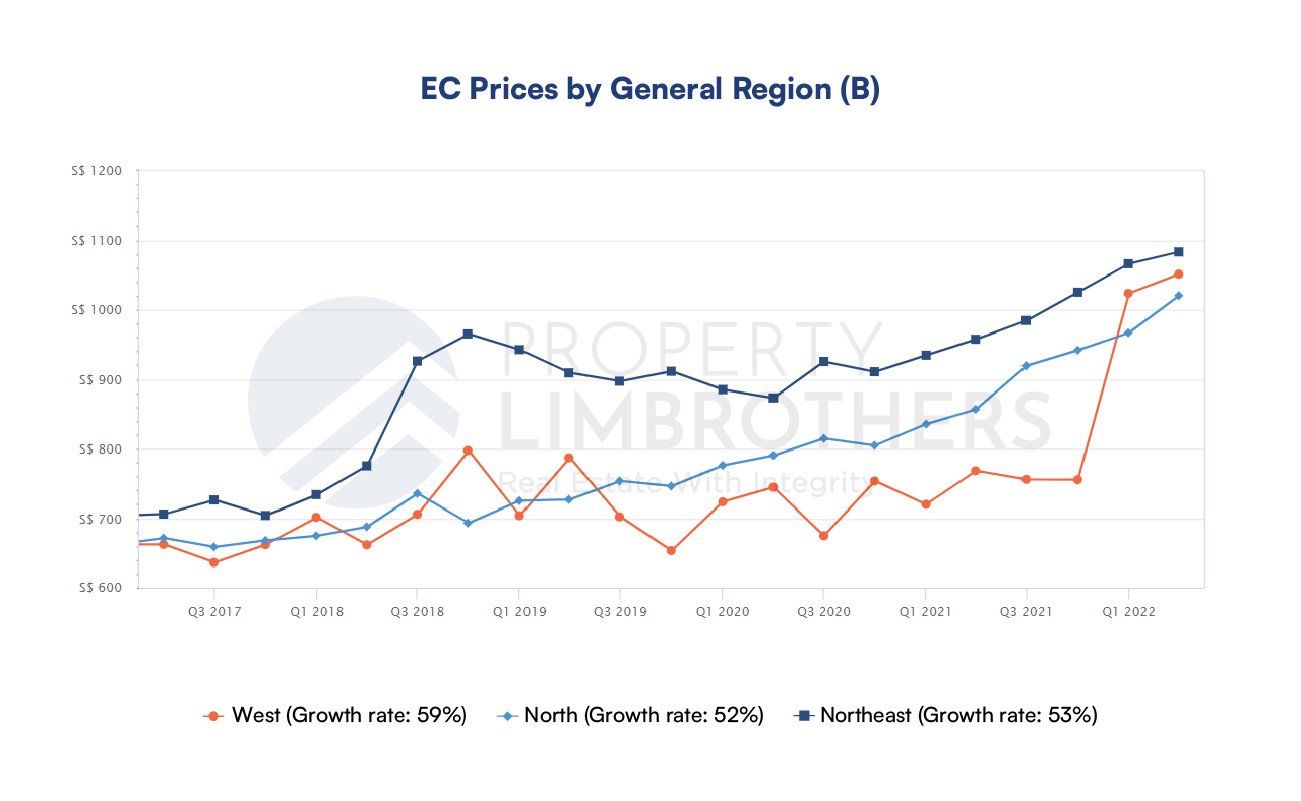
Executive condominiums have performed almost as well as the HDB segment, putting in 19% growth since the pandemic. This is looking only at the resale market for ECs due to the sporadic nature of EC releases which might distort the general understanding of the market. The general uptrend is strong and only displayed some volatility in Q3-Q4 of 2020 during the pandemic.
Performance in ECs is different from HDBs in the sense that it is driven more by differences in size rather than location (with the exception of the northern corridor). We see that larger unit sizes have disproportionately larger growth. Units that are more than 1500 square feet grew 59% since 2019 whereas units that are 1,000-1,500 square feet grew 31%. Smaller units under 1,000 square feet only grew 13%. This is a stark difference in growth rates despite the short time period of over 2 years. The data is pointing to larger units as the better choice when buying ECs.

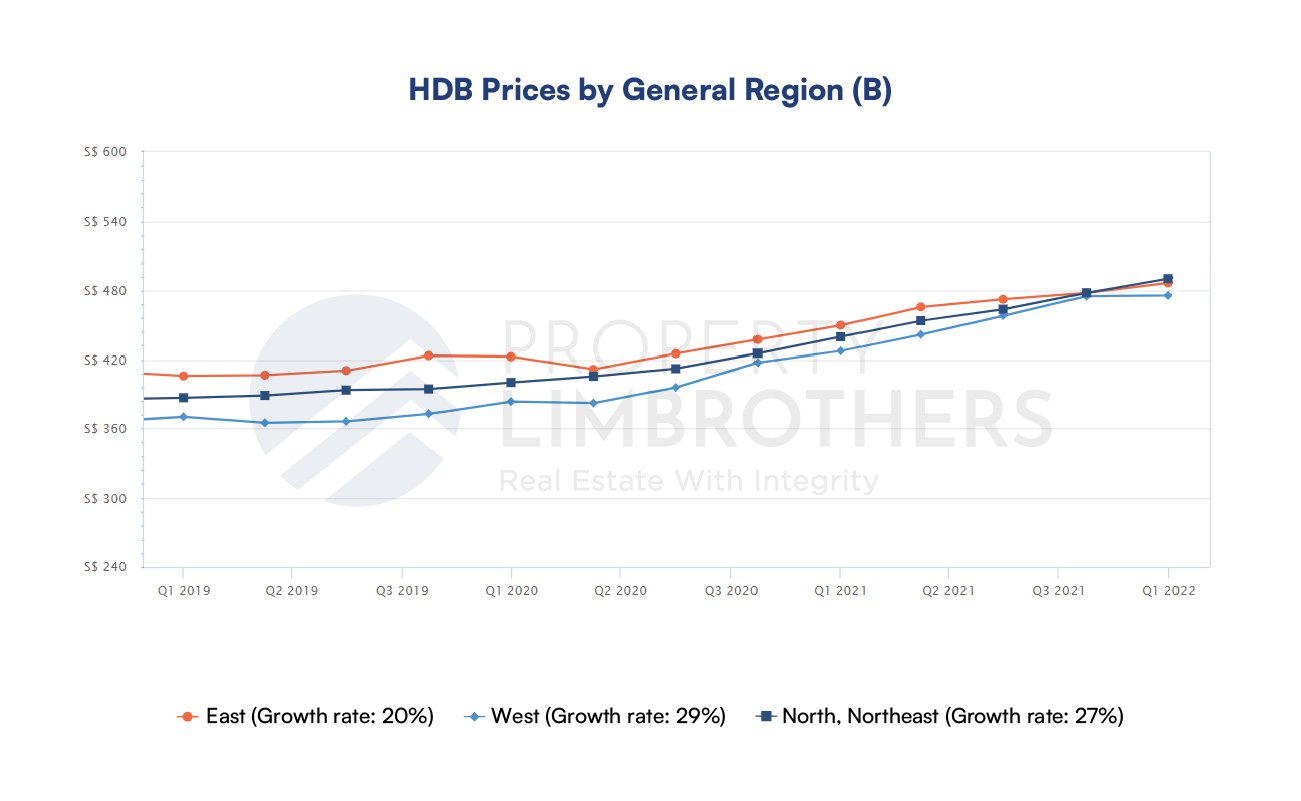
Looking at location, the performance of ECs in the general central and western regions of Singapore has performed well at 41% and 45% respectively. On the other hand, ECs in the North and Northeastern regions have only grown 21% albeit with higher consistency and less volatility. Taking a deeper look at breakdown of the North and Northeast regions, performance is lower for Northeast regions. The North region grew 33% since 2019 and The Northeast region grew 13%. The West region performed the best owing to a strong Q1 performance.

Overall, performance in the EC segment seems to be largely driven by large ECs and ECs in the Central and Western regions of Singapore.
State of HDB/EC Upgraders & Non-Landed Private Entrants
The macro headwinds in 2022 will present challenges to HDB or EC upgraders. The higher interest rate environment and soaring inflation will make it extremely difficult for upgraders to time the market. This is a cautionary warning for HDB and EC owners who might have their property near the end of the MOP. Deep market analysis is required for a prudent move into another property as prices are elevated and value, hard to identify.
High reinvestment risk with unfavourable macro outlook might translate to slowing transaction volume in the coming quarters. As higher mortgage rates and inflation might translate to significant downsizing if current HDB and EC owners decide to upgrade into a new property. Even though the strong performance of the HDB and EC market may tempt some owners to realise paper gains, the reinvestment risk is very high.
We would advise against a property play without an elaborate exit strategy for the current and subsequent property.
Private Condominiums


The segment for private condominiums presents an interesting trend. New sales for private condominiums have exhibited strong growth at 26% since 2019. However, resale property prices show a modest gain of only 5%. This pattern brings up a serious question if new projects are overpriced or if resale private condos will grow to match the much higher prices. Further investigation on this topic is needed moving forward into the next few quarters and 2023. All mentions and charts of private condominiums in this report include apartments as well.
Based on the breakdown of new private condo sales by size, we see that larger sized properties (hence, larger quantum) had the biggest dip due to the pandemic. However, its price has re-established the uptrend and has recovered. The following quarters might see new sales with sizes 1500-2000 square feet attempt to push to higher prices around S$2,300 to S$2,500 psf (approximately S$400 psf higher than smaller sizes).


Resale private condos appear to have a similar pattern with new sales. The main differences here are lower growth rates and a muted dip for larger condos. Resale condos that are large also do not exhibit the same premium pricing as compared to new sales over the course of 2019. These findings indicate that the demand pool for mid-sized condominiums might be weaker, pushing down the PSF for this subsample. However, as the property market continues to inflate, this subsample might offer good growth opportunities.
In terms of the subsample by location, CCR, RCR, OCR, do not offer much counter-intuitive or interesting insights. The results are intuitive and inline with standard expectations. It is important to note that resale CCR private condos have put in negative growth of -4% since 2019, although prices might recover over 2022.


In the private condominium segment, mid-sized resale condos might offer a decent risk premium compared to other properties in the segment.
Performance of Singapore’s Luxury Segment
The K-shaped recovery has favoured the luxury segment. The GCB subsample exhibits the highest growth compared to other subsamples in the private property sector (including private condos). The additional affordability concerns brought in by rising interest rates and inflation will affect private condo demand more so than the luxury segment due to the constraints on individual financial cash flows.
In a separate study, large scale reallocation of portfolios from HNW and UHNW might spur demand for Singaporean real estate. Real estate offers lower volatility with modest probability of returns and helps to meet the legacy and wealth inheritance needs of this demographic. Luxury Properties to see higher prices amid tight supply and growing demand.

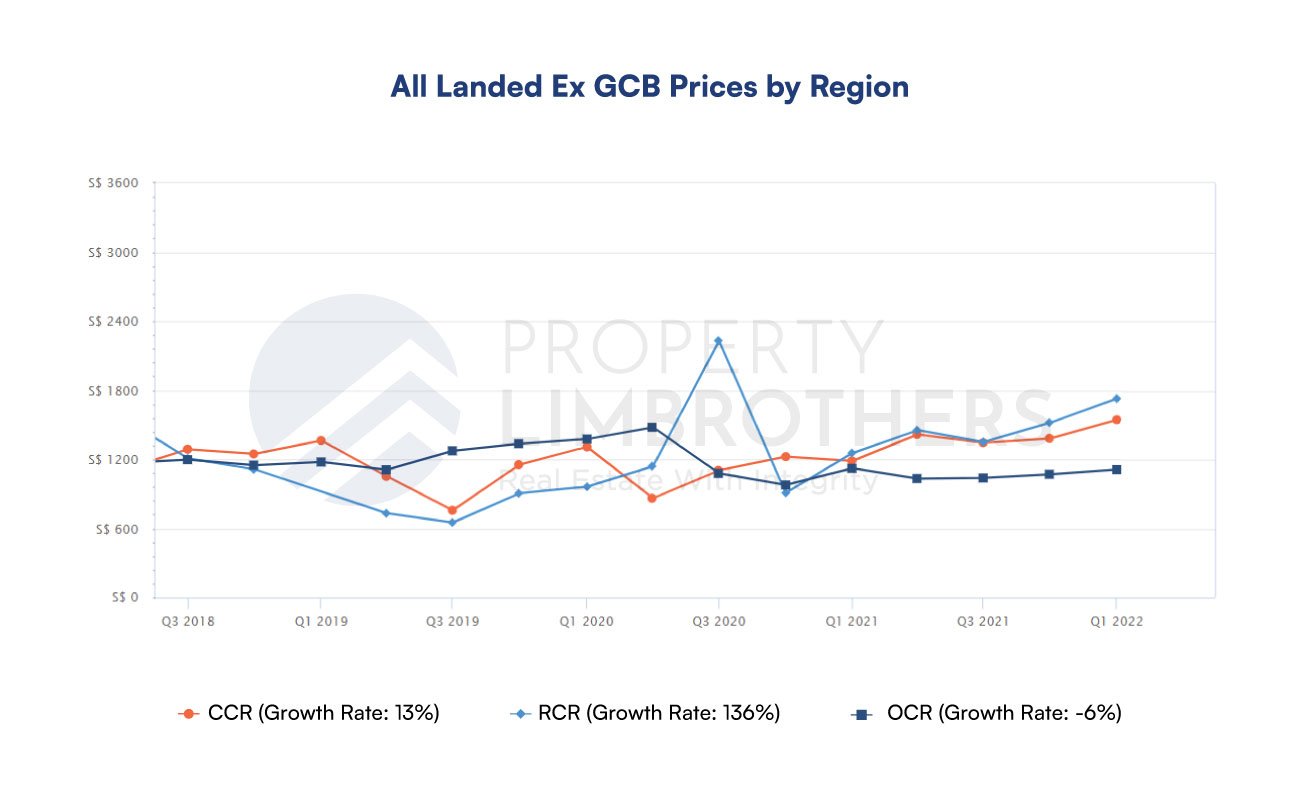
Looking specifically at the Landed ex GCB sample, we see that RCR properties put in the highest growth. Note that the results in the luxury segment will have a higher variance between properties as they tend to be more unique and differentiated (especially for landed properties). However, volatility of prices within properties over time is expected to remain tame. The high growth numbers could be motivated by outliers or unique projects that will be covered in a further study. OCR Landed properties would also need to be closely monitored as they might potentially climb over its peers in terms of price.
Next, we look at the sample for luxury condominiums. This includes D9/10/11 Condos. We break down the luxury condos by size. We categorise condos above 2500 square feet as the upper spectrum of luxury condos, which appears to have the highest PSF but also exhibit the highest volatility. This might be due to some overextended buyers who had to let go of their property amidst the pandemic. Generally, the prices recovered sharply and maintained a PSF higher than smaller luxury condos units.

Zooming into only the resale luxury condos, we see that the upper spectrum of luxury condos exhibit a similar trend. The premium commanded by these larger exclusive units appear to be catered to by strong demand from the UHNW segment with prices pushing much higher above regular sized luxury condos (1-5 bedder range).

The luxury segment has obvious favourites. GCBs and extra large luxury condominium units have shown strong performance since 2019. This is no coincidence. These properties are typically the highest quantum projects, indicating that the high ABSD environment might encourage UHNW individuals to opt for a concentration strategy rather than decouple.

Rental Market Outlook and Performance
The rental market is not receiving enough attention in terms of analysis. As the property market is typically driven by buyers and sellers, renters usually fall through the cracks. We hope that this section is useful to our readers in helping make sense of the heated rental market. Since the pandemic, rental prices have shot up 13% for HDBs and Private Condos. Rentals for ECs rose by 25%. These are non-trivial numbers and will translate to a much higher cost of living for certain demographics.

One might speculate that this trend might be a symptom of pandemic-related migratory, or work from home patterns. The relaxation of safe management measures in Singapore will soon show the rental price uptrend would persist. However, this rise in rental prices would likely be worsened by affordability issues based on rising mortgage rates. With less affordable housing options, the rental market will continue to heat up. The rental market is likely to continue to boom or consolidate at a high price unless there are significant government interventions.
The rental patterns being highlighted in this section show across the board hikes in rental prices. This generally signals a very strong market with broad participation. It is plausibly the result of participants being priced out from the ownership market. If this is the main cause of the trend, rental prices will continue to soar over the next few quarters and 2023. Unless interest rates fall or inflation is brought down, the rental market shows no signs of slowing down.
Apart from the broad participation in the rental market, there are no remarkable trends or counter-intuitive finds in the charts.


Commercial & Industrial Real Estate Performance

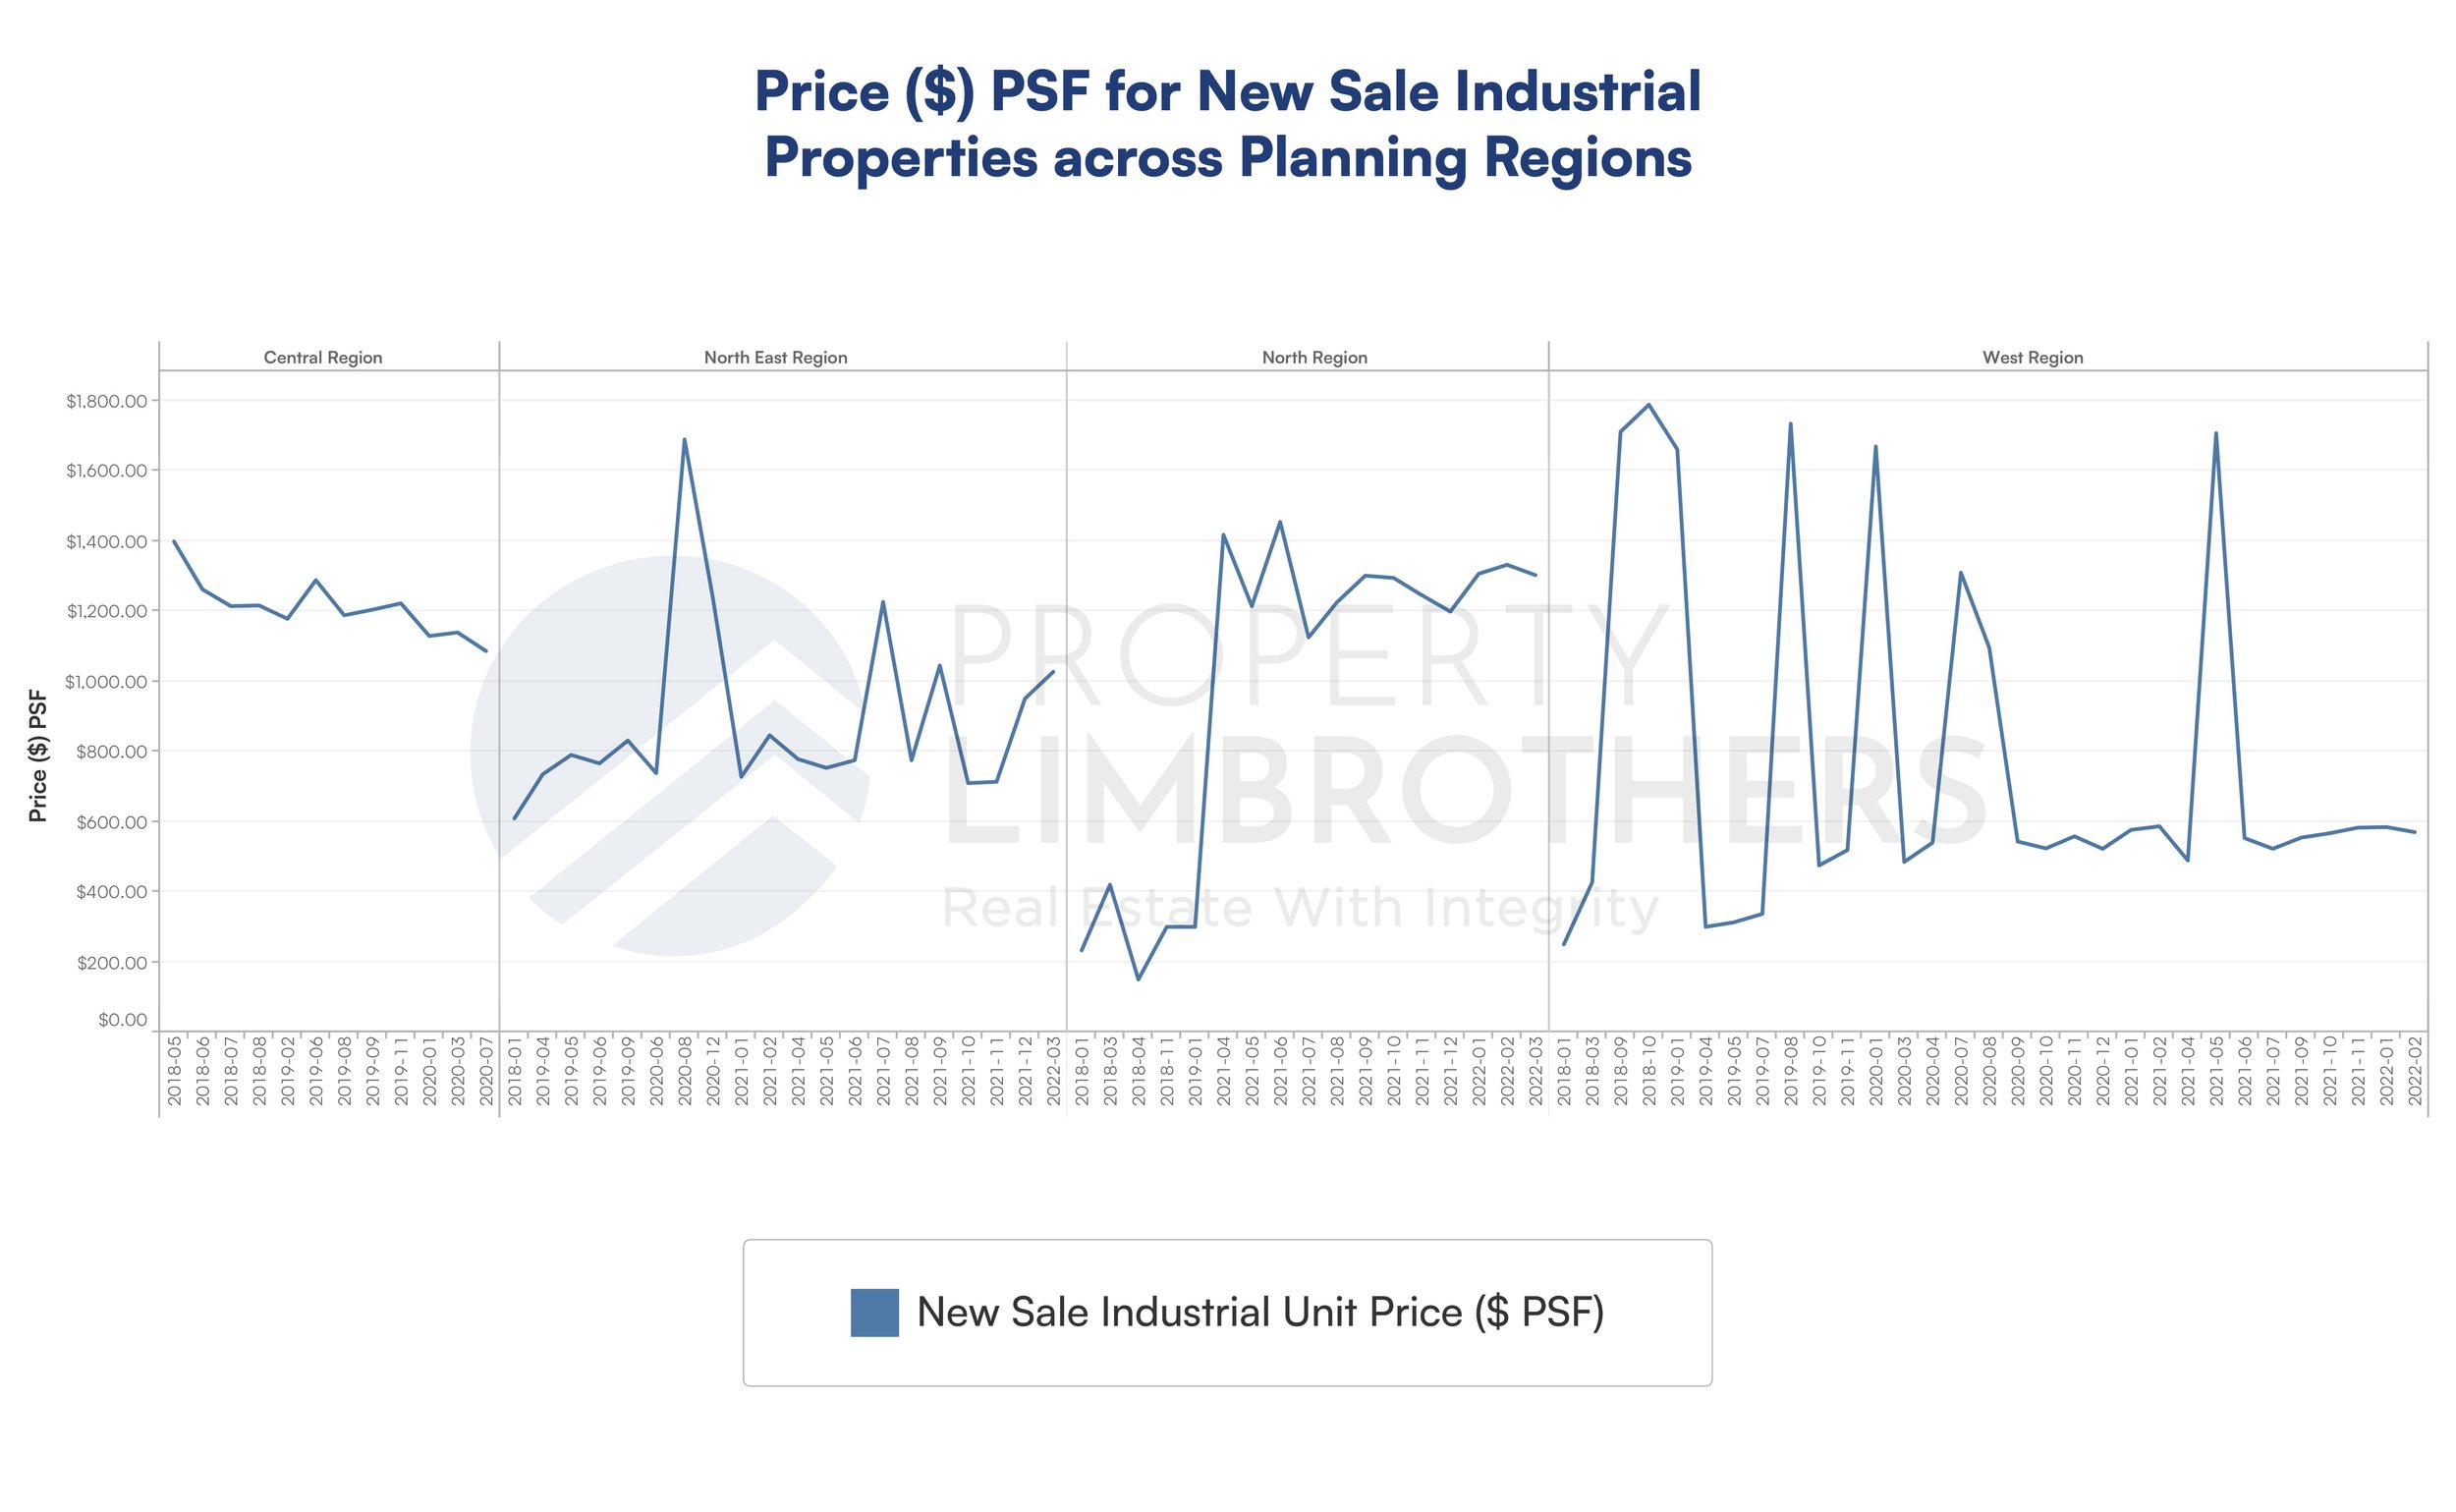
Commercial and industrial performance are recovering, finding support at current levels in the past 2 quarters. Retail-specific commercial property is currently in a period of consolidation, and is likely to improve with reopening of the economy and easing of safe distancing measures. We would like to highlight that commercial Shophouses still maintain a leading position as a subsegment for commercial real estate.

While commercial and industrial properties offer value in terms of discounted prices, their long term trends are not as strong as the commercial shophouse segment. We take a deeper look specifically at the commercial shophouse segment in this report.

The breakdown by location will be our main way of pinpointing the growth. Graphically, central shophouses command a price premium as expected. And offer good growth opportunities. While north and northeast regions exhibit a high growth rate, prices are still under central, east, and west regions. A closer look shows that the northeast region is primarily the highest growth subsample at 52% since 2019.


A caveat to the trends of commercial shophouses is that it is a small numbers game. Transaction volume is typically much lower than residential properties. However, strong demand and a low supply of shophouses in the market help to prop up the price and offer better growth over its peers among commercial properties.
Potential Growth Opportunities for 2022 and Beyond
We have covered different segments of Singapore’s property market along with the global macroeconomic environment and local Singaporean policy considerations. To conclude the 2022Q1 report, we would like to highlight three potential growth opportunities for 2022 and beyond. It is important to note that the exact selection of properties matter in these opportunity spaces as high variance in performance might exist between projects.
The Luxury Property Segment, particularly GCB and Large Luxury Condos. These segments cater to UHNW individuals. Amidst portfolio rebalancing in tough macro factors, exposure to real estate in Singapore could be a way to meet multiple needs. Reducing volatility of the portfolio along with satisfying legacy planning needs could put GCBs and Large Luxury Condos as a prime option for this audience in 2022.
The Commercial Shophouse Segment presents an alternative to foreign investors looking to avoid ABSD obligations and also cater to UHNW/HNW demographics looking for greater exposure to real estate. Commercial shophouses are also an option for business owners looking to accumulate assets or own their own space.
The Mid-sized Non-Landed Private Condominium Segment is noteworthy. This is a recommendation based on the assumption that it is an investment property. If this is used as a residential property, family needs should be seriously considered due to the relatively smaller size. In particular, we are referring to resale private condos between 1000-1500 square feet in the OCR. This option offers value at an affordable price compared to its peers. For a hostile macro environment, this is a more prudent option than bigger units.
We hope that this report has been helpful to you in your property journey. Look forward to our editorial work that will continue to explore these themes put out by our quarterly reports. Thank you for supporting PropertyLimBrothers.
Caveats & Disclaimers
The findings of our report are reliant on the data accuracy and integrity of URA’s published data, REALIS, Squarefoot and Edgeprop API. We rely on these counterparties for data and filtering tools to help us with data slicing and subsample analysis.
This report is a non-parametric analytical study. We do not include the use of any economic, forecasting, or machine learning models in arriving at our conclusions. Forecasts and predictions made are based on theoretical insight from economic theory and extrapolating current trends.
Supplementary Charts


Disclaimer: Information provided on this website is general in nature and does not constitute financial advice.
PropertyLimBrothers will endeavour to update the website as needed. However, information may change without notice and we do not guarantee the accuracy of information on the website, including information provided by third parties, at any particular time. Whilst every effort has been made to ensure that the information provided is accurate, individuals must not rely on this information to make a financial or investment decision. Before making any decision, we recommend you consult a financial planner or your bank to take into account your particular financial situation and individual needs. PropertyLimBrothers does not give any warranty as to the accuracy, reliability or completeness of information which is contained in this website. Except insofar as any liability under statute cannot be excluded, PropertyLimBrothers, its employees do not accept any liability for any error or omission on this website or for any resulting loss or damage suffered by the recipient or any other person.

PLB On Telegram
Home tours and property news — straight to your device.

Insights On Telegram
Fresh articles, market trends and news — right to your device.


Subscribe to our YouTube Channel

PLB Newsletter
Stay up to date with the latest property news and development

The PLB Seller Experience

Coming Soon!