
No event in the commercial world is isolated, shifts in business markets, trends in human behaviour, technological breakthroughs and even the pandemic (as witnessed recently from the world’s Covid-19 ordeal), can and will have significant effects on the market. In a more microscopic view, no property price movement in real estate can stand alone from the other. A shift in one sector or region will have implications on other segments in the market.
In this article, we will explore how property price movement is linked across property types and even across regions. We will first talk about the trends happening within the non-landed market, and then explain more about how these trends differ across regions in Singapore. Based on these correlations and current trends, we posit that non-landed properties in the CCR will be the next hot zone.
Price movements are correlated between new launches and resale
At a fundamental level, all new launches eventually become resale properties. This means that the number of new launches and resales move in a cyclical fashion as new launches that were bought up feed into the resale market, and older resale properties get torn down to develop into new launches.
Sellers of new launches and resale are competing in the same market, as buyers constantly weigh between both property groups for their homes. In the short to medium term, we observe that the prices of new launches lead the prices of resales. What this means is that the benchmark that new launches often set, allow resale properties to follow suit. Should a new launch project be sold at 2000 PSF, it is likely that the resale market will move up and closer to this PSF, although there are still other factors such as amenities, size, tenure and location to consider.
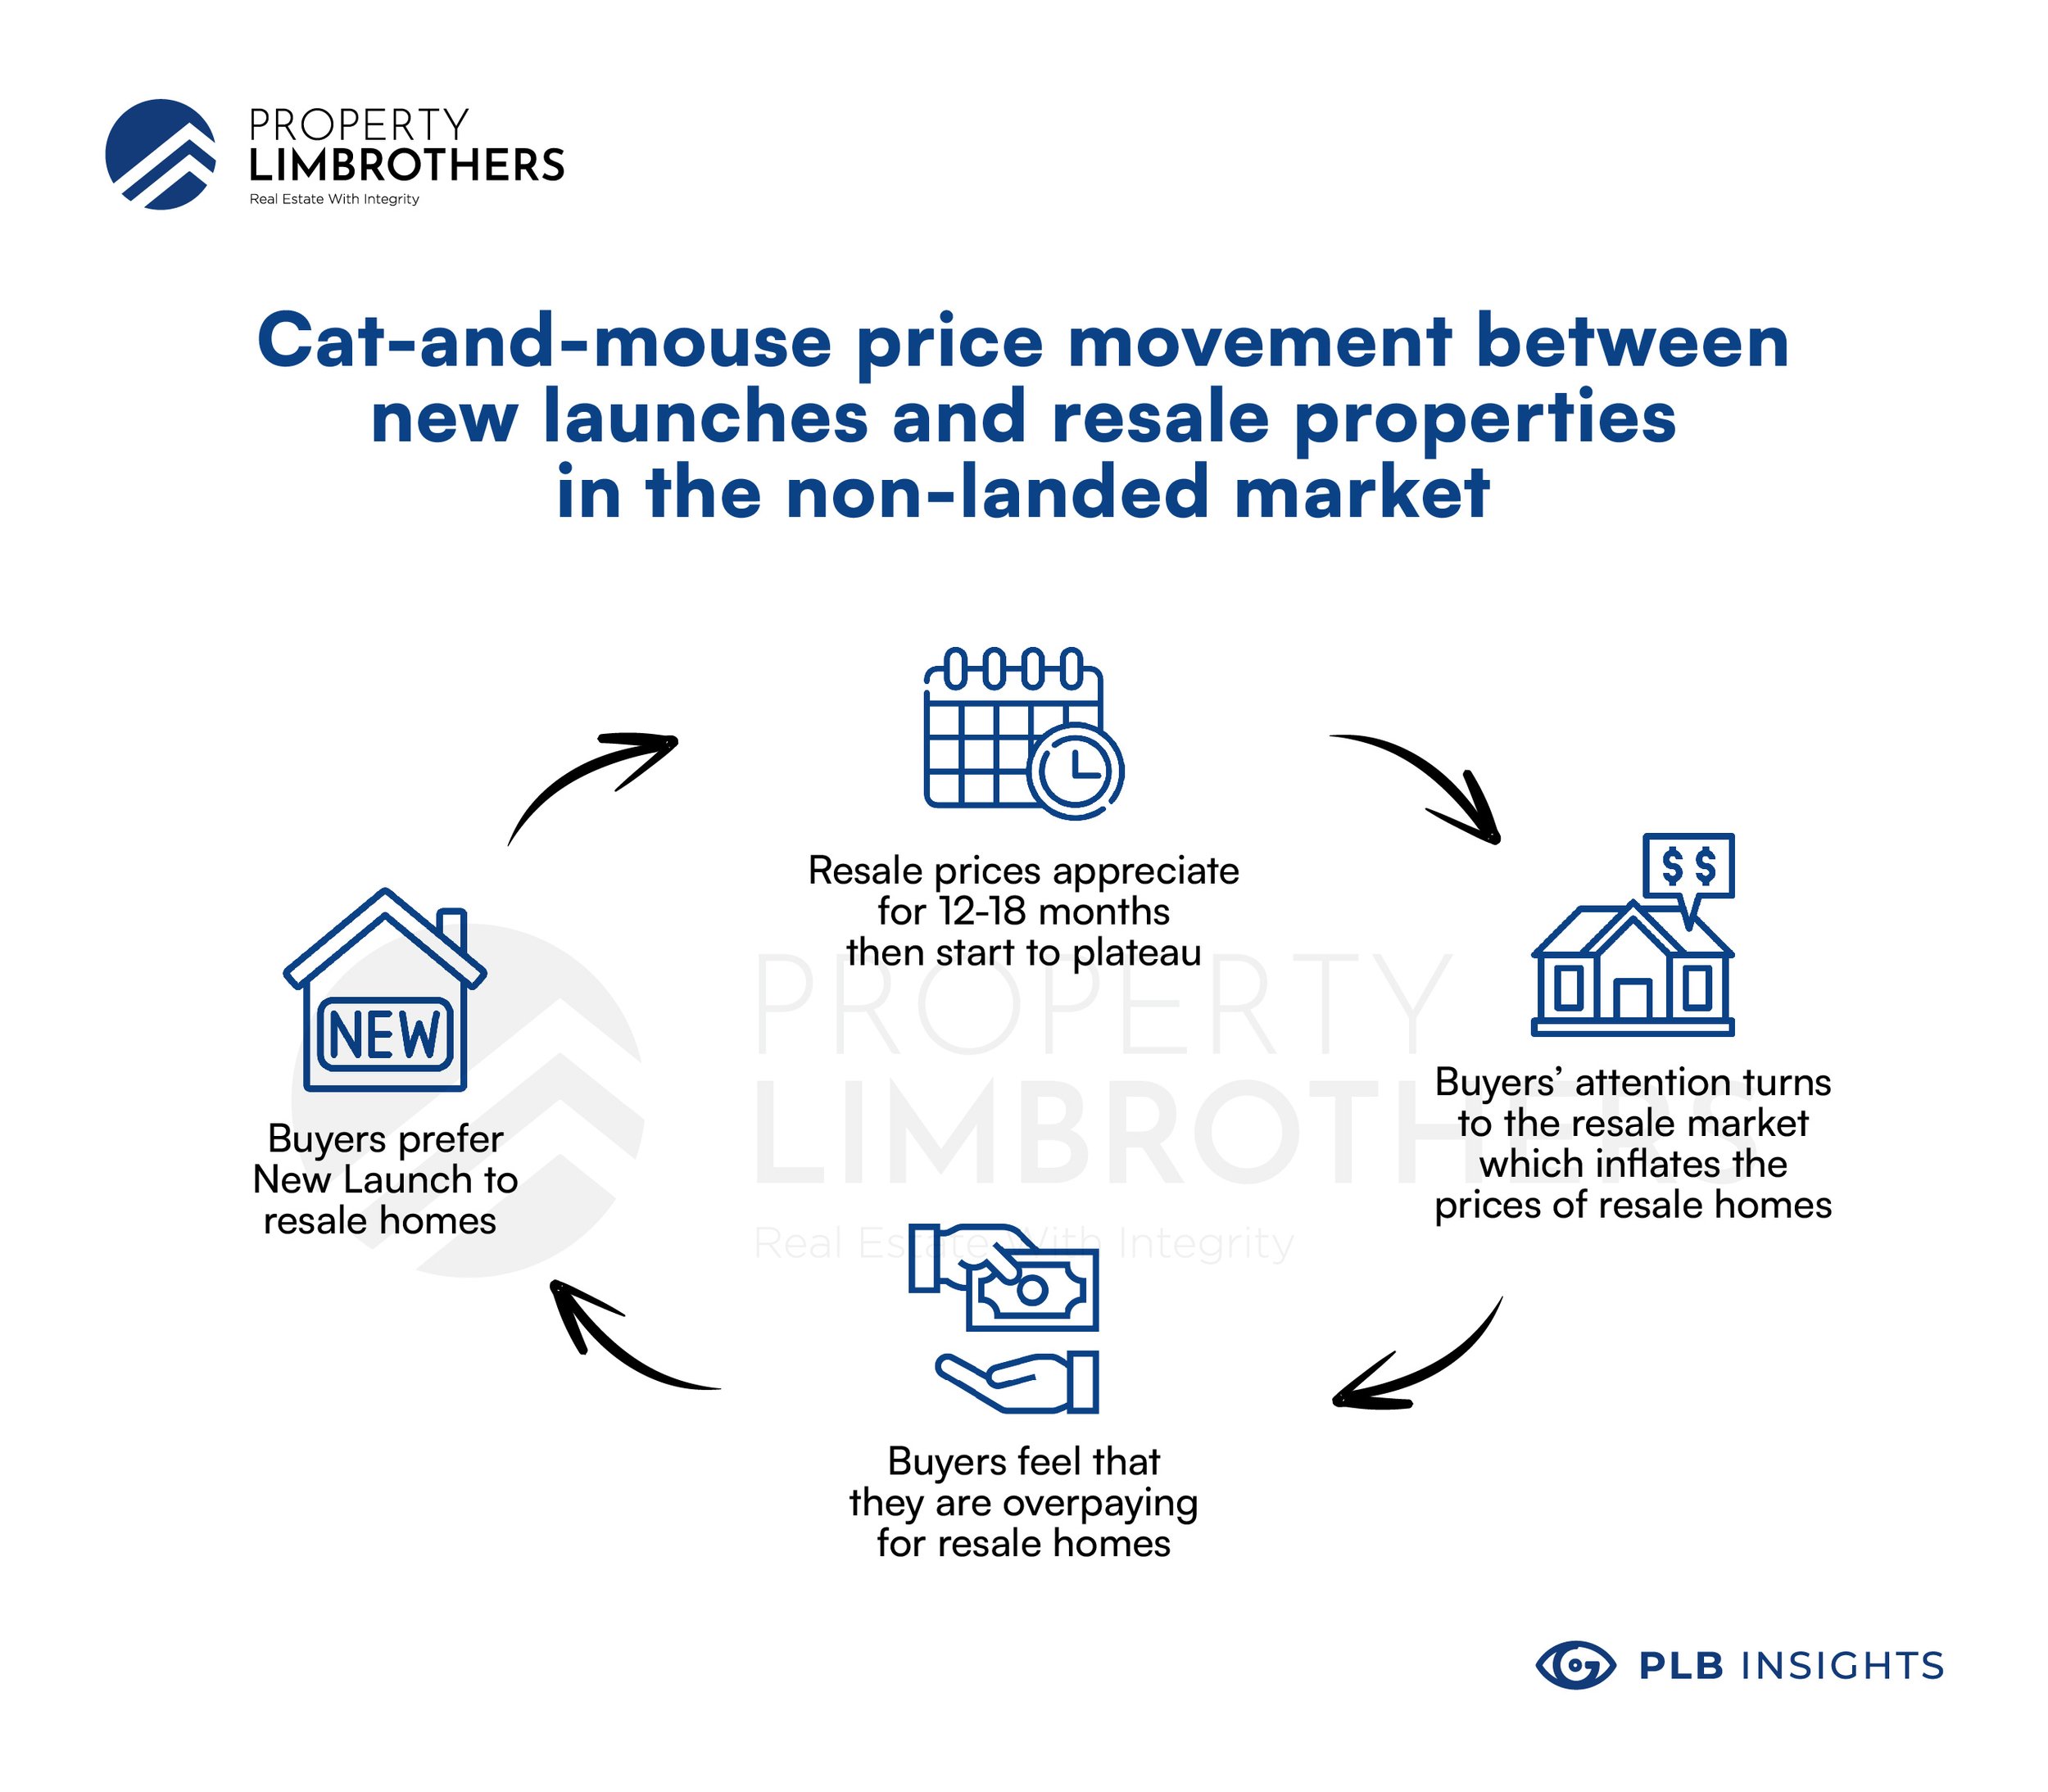
Typically, new launches that rise in price will plateau off after 12-18 months once the price reaches a level that is too high for buyers to consider as an alternative to resale. When this happens, buyers shift their attention to the resale market, and resale units will start to appreciate in value. As resale values start approaching that of new launches, buyers may feel that they are overpaying for the resale unit. After all, why should one pay so much for a resale if the same price can get them a brand new apartment?
This shifts the focus back to new launches which then appreciate until it moves out of the range to be considered as a good price relative to resale. This cat-and-mouse price movement is typical of the property market since buyers can find alternative properties at comparable prices. Such price movements are seasonal and may stretch out over months and years.
As buyers, we should understand the current season of the market and how the cycle will play out in the coming 12-24 months. This knowledge contributes to the decision of whether to buy a property and what kind of properties to buy.
Overall non-landed market trend
Looking at the overview of the entire non-landed market in Singapore, it is clear that prices and transaction volumes have risen over the past 12 months. This gives us an indication of how the entire market is doing, but not in a way that fully informs us of which properties to invest in.
While it appears that the volume of resales and new launches have both gone up in tandem with price, we need to be wary that medians and averages tell only part of the story. Each district has its own balance of new launches and resale volume which will affect how their trends are interpreted; in other words: while the general trend indicates an increase in both volume and price of properties in the non-landed market, these patterns have to be situated within particular regions before we can make sense of them.
Analysing district-specific trends: Districts 09 and 19
In general, the volume and price of resales and new launches have both increased. However, when we take a closer look at the trends in different districts separately, a different story can emerge. As an example, we can look at the differences between CCR District 09 (Orchard), and OCR District 19 (Serangoon Gardens), both of which are highly popular for non-landed properties.
District 09: Resale vs. New-launch volume
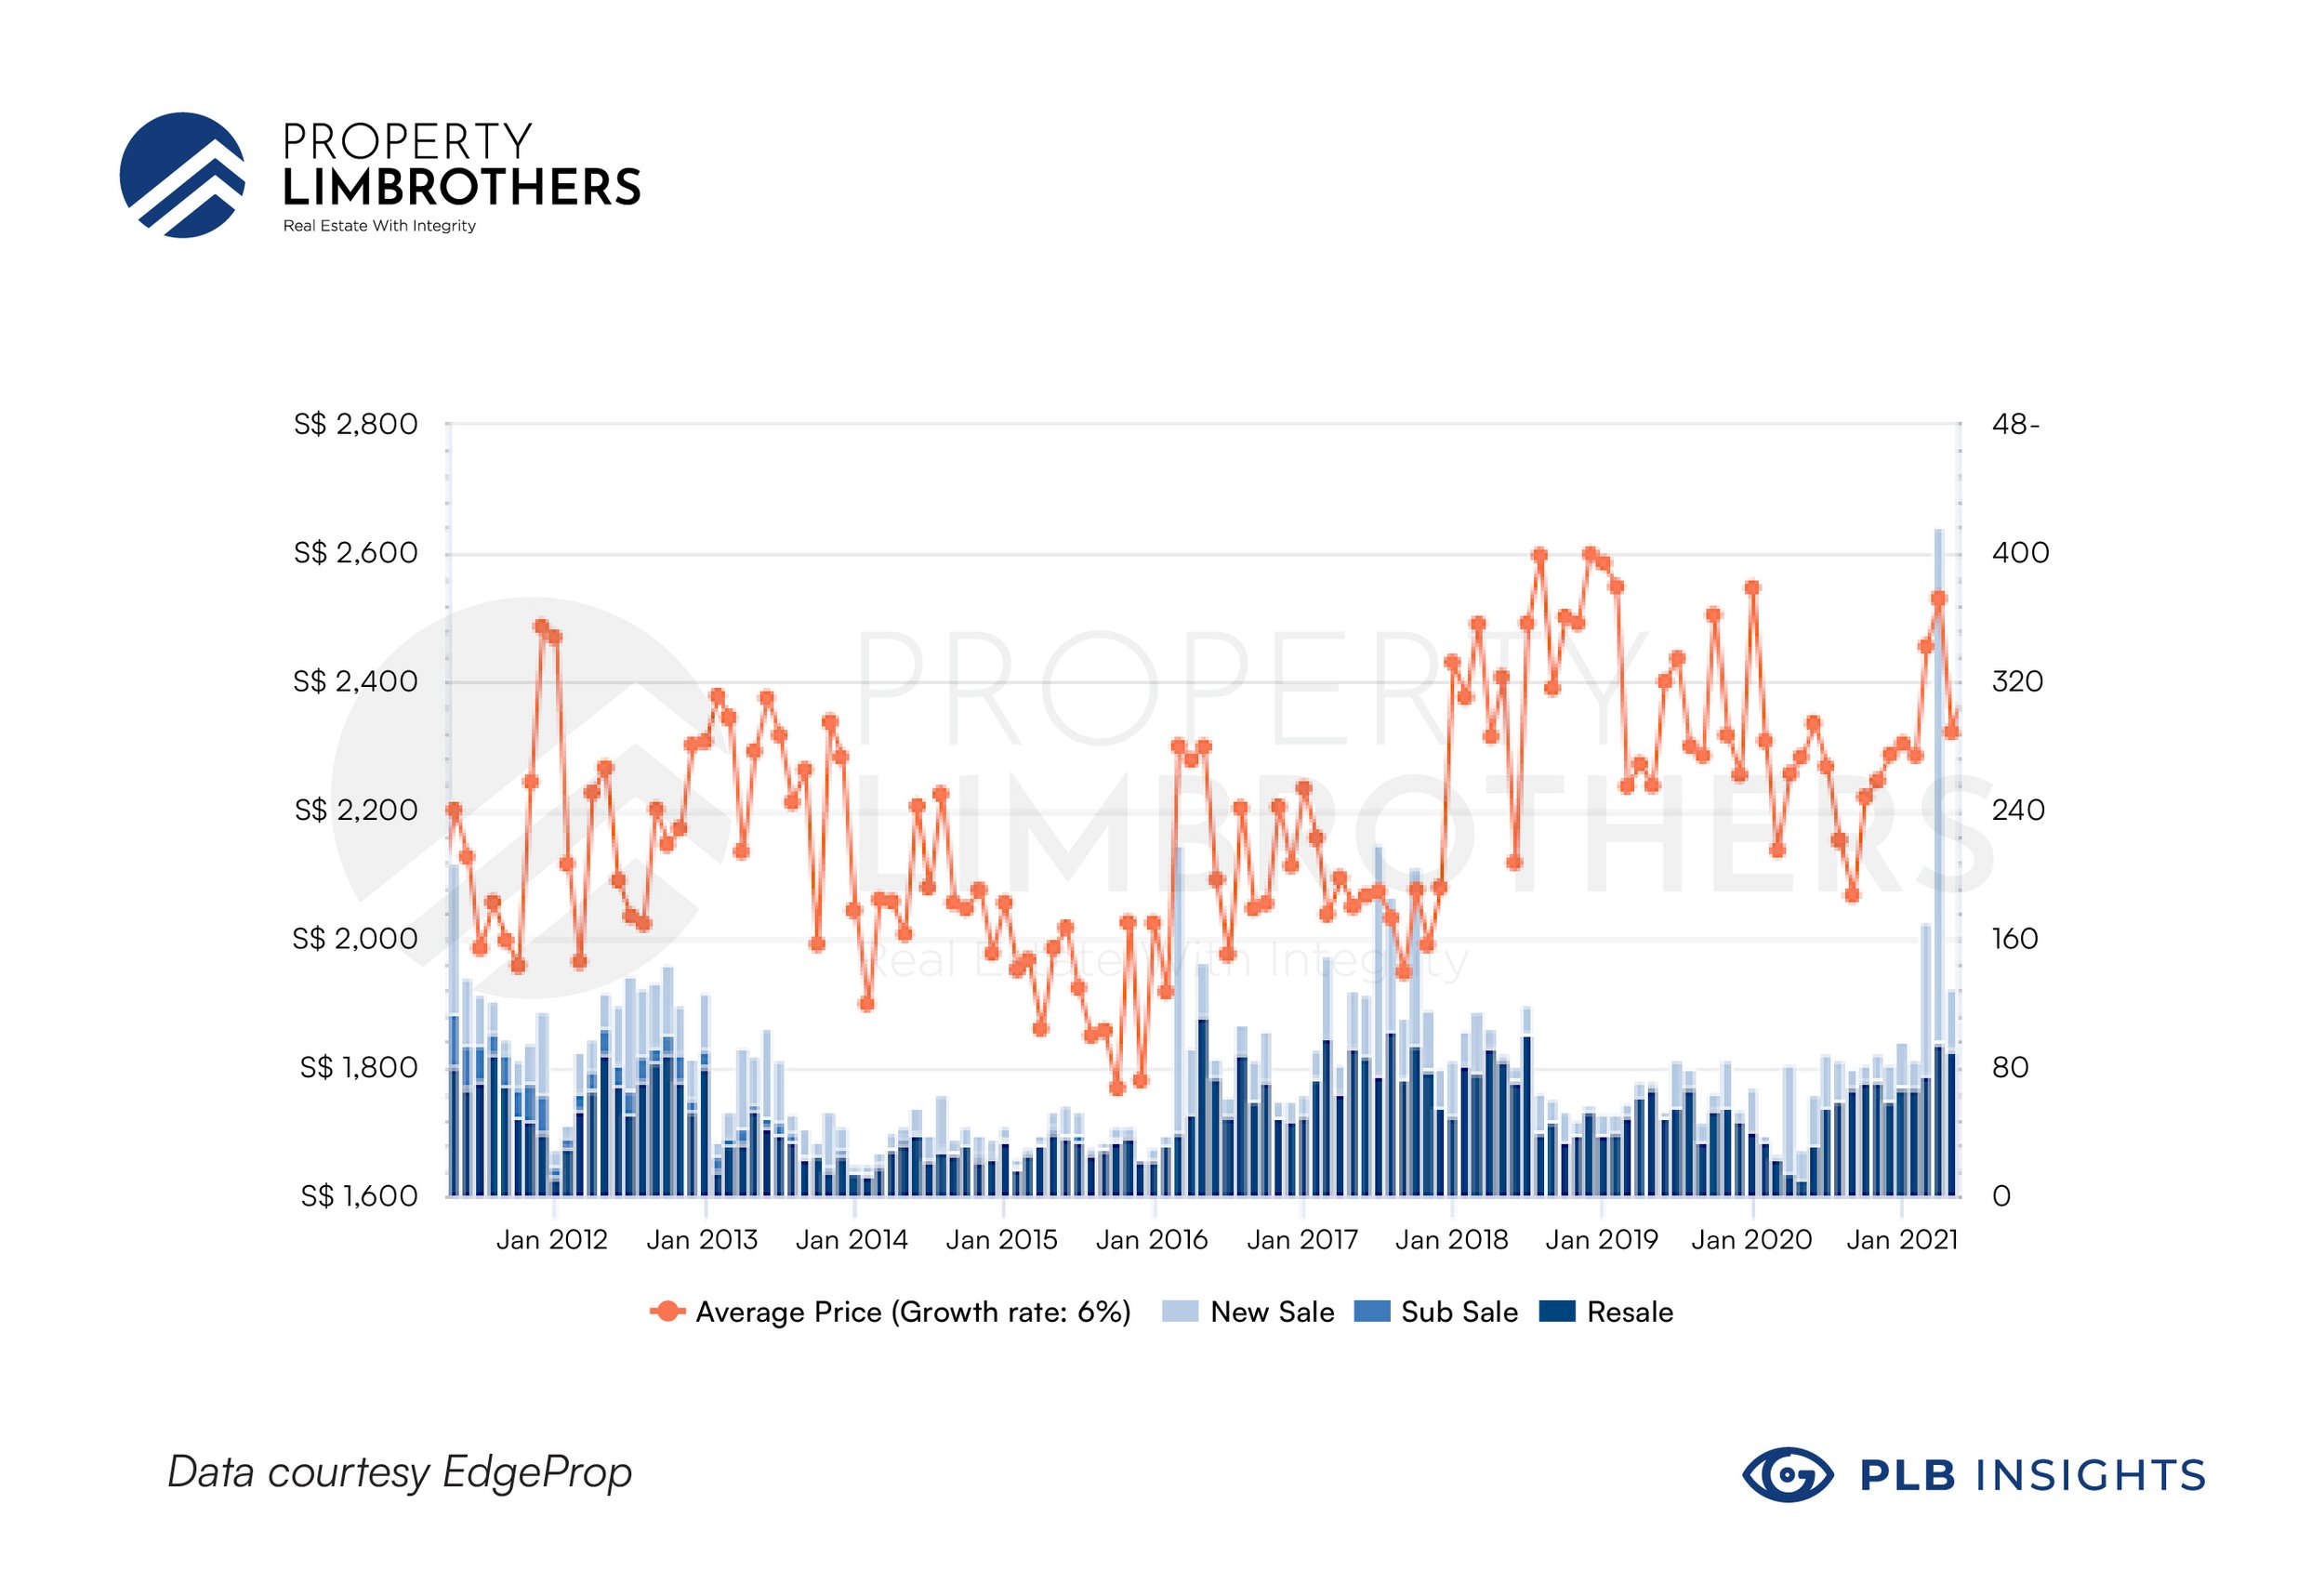
Resale volume for District 09 ranged from 50 – 80 transactions per month for the past 12 months. The New launch volume was much lower, ranging from 20 – 40 transactions per month, with the exception of April. However, we can consider this an outlier as it was due to the highly anticipated Irwell Hill Residences which sold 50% of its entire 540 units available within the first weekend of launch.
District 19: Resale vs. New-launch volume
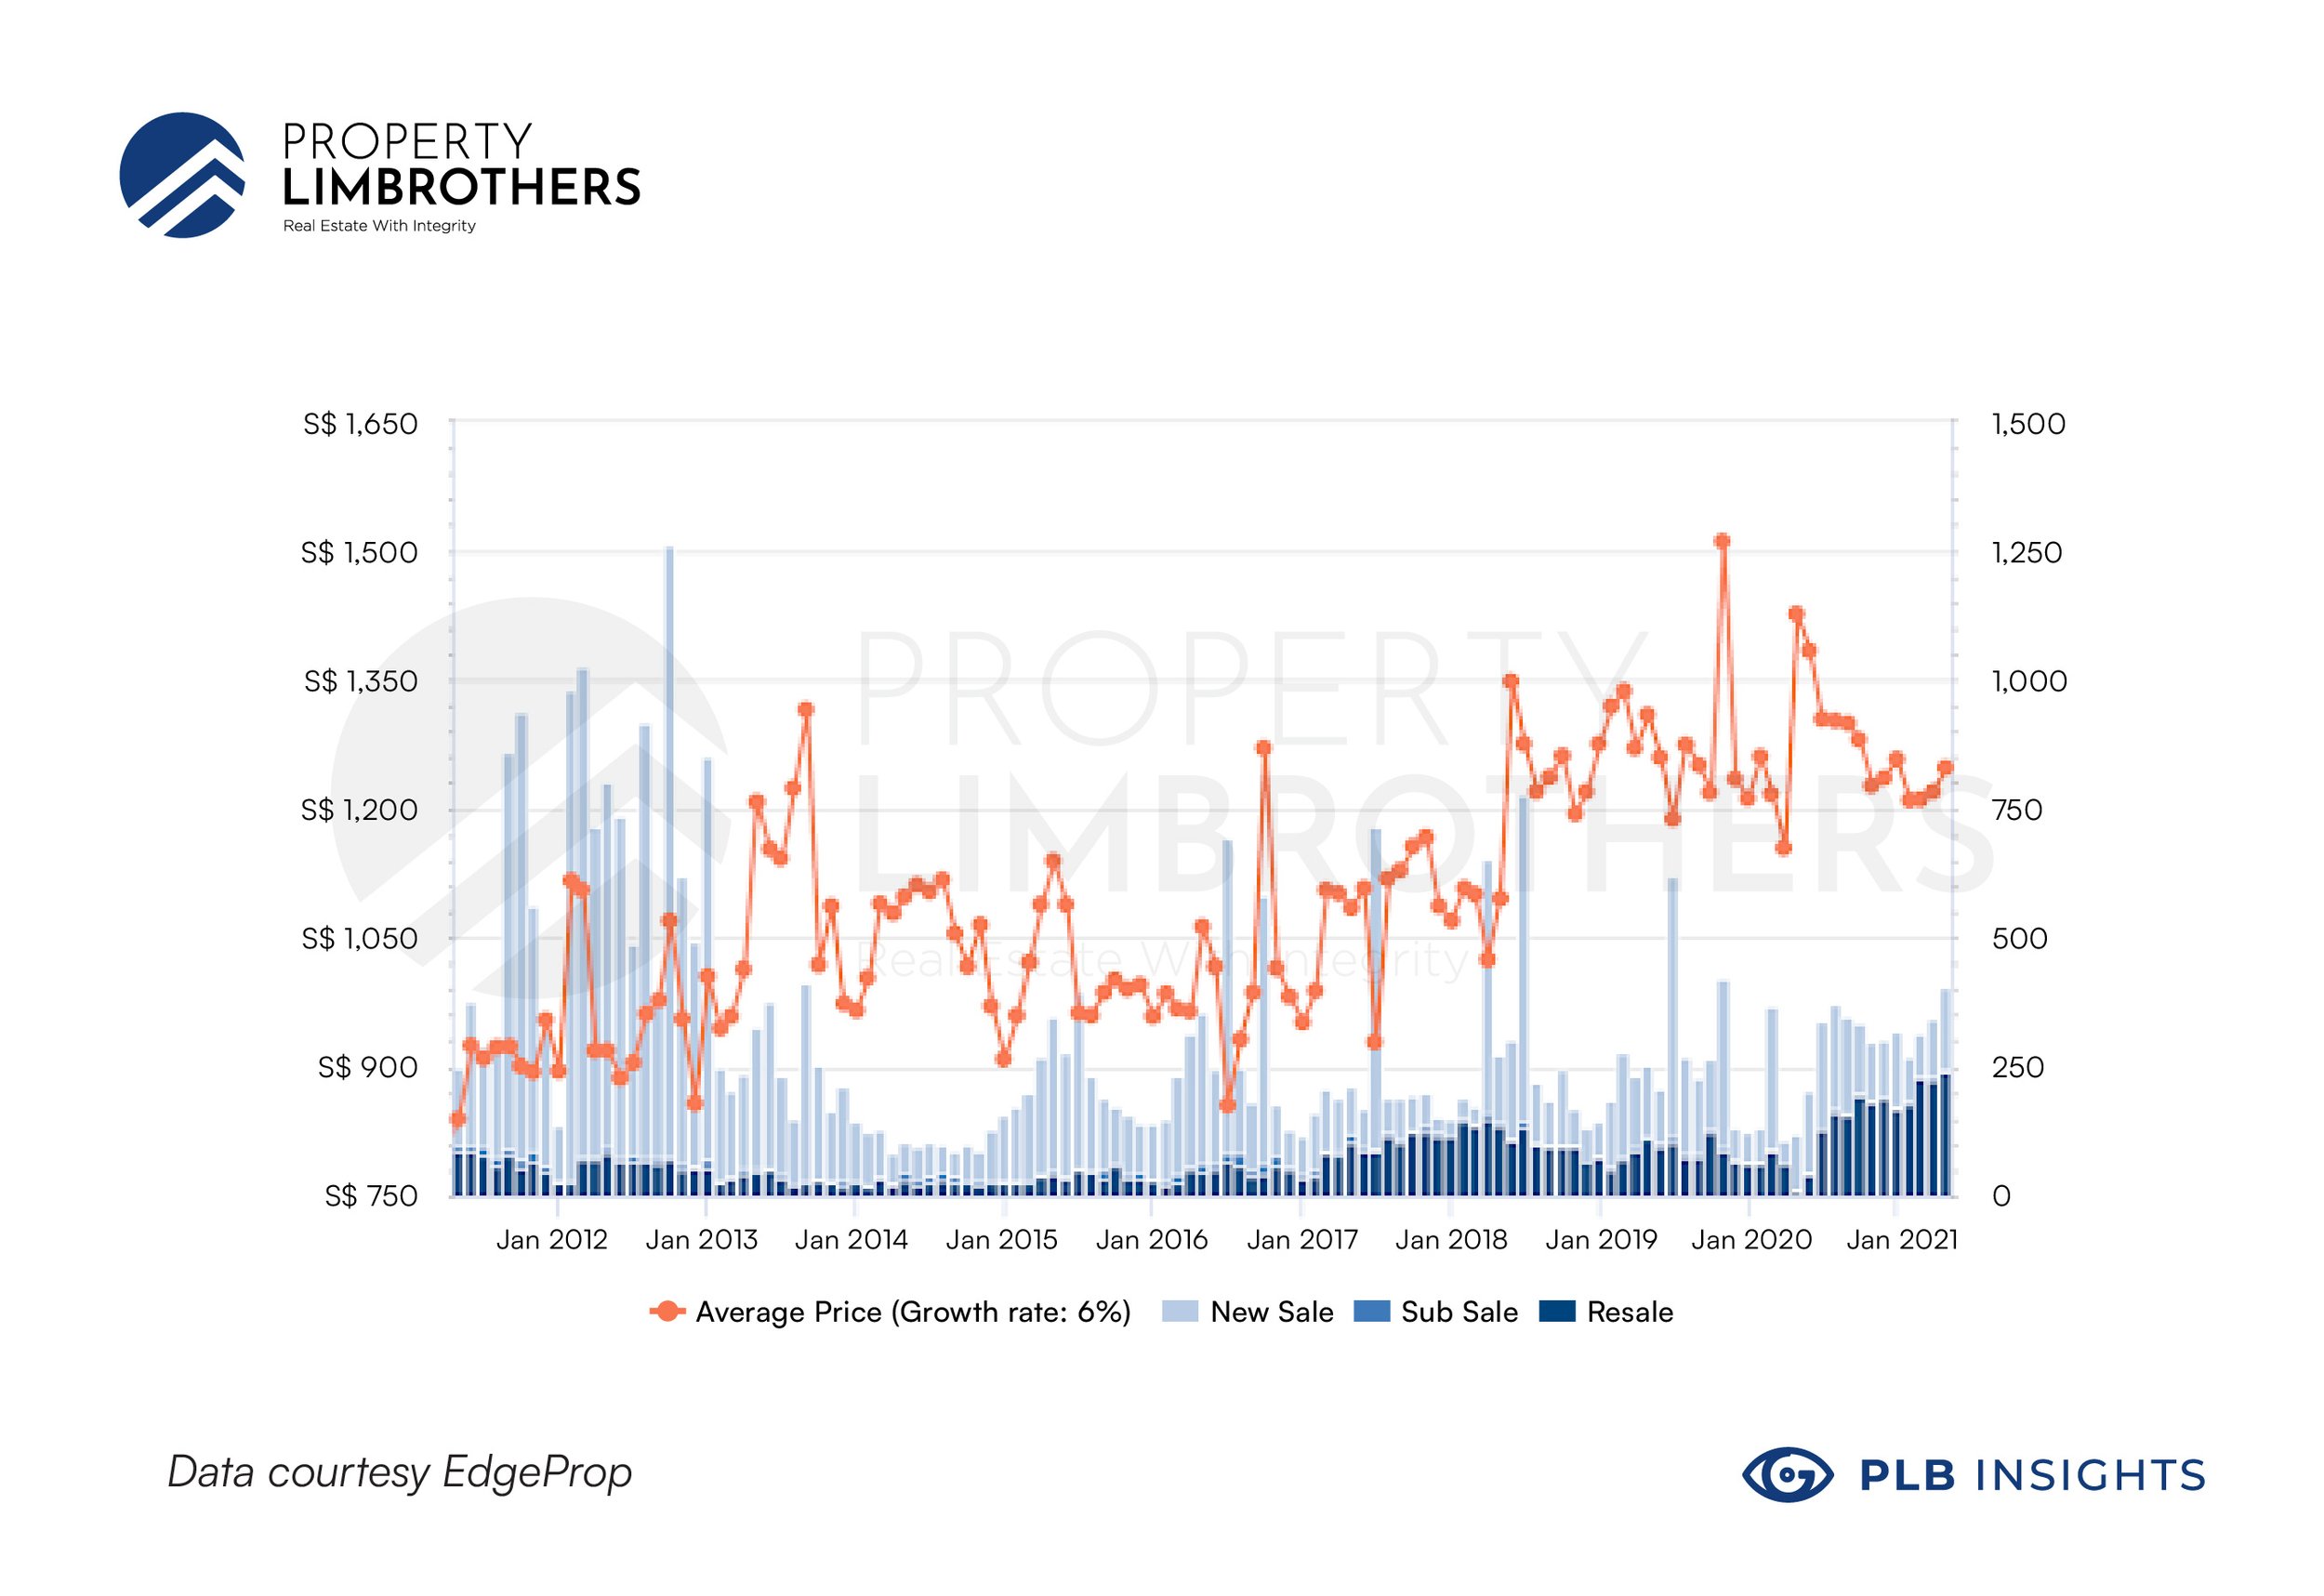
From the data, District 19 shows similar numbers of resales and new launches. This is different from District 09, which appears to have twice as many resales than new launches.
From this simple comparison between the 2 districts, we can already see unique traits appearing. Thus, it is important that buyers study the specific trends of districts in addition to the overall market trend.
Regions differ by their resale vs. new launch volume.
One reason why new launches could differ in price, lies in where the acquired land is located. CCR new launches are more limited and smaller in land size as they are typically developed on land acquired from en bloc. The lack of available land in the region means that en bloc land has to be subdivided into smaller plots which limit the size of the new launch.
On the other hand, OCR and RCR new launches tend to be larger and more frequent since land is more readily available from Government Land Sales. Knowing that supply always affects the price, we know that these unique characteristics affecting the volume of resale vs. new launches are not only superficial, but also have an impact on the price of these properties in the non-landed market.
Non-landed CCR has not yet had it’s run-up compared to OCR and RCR.
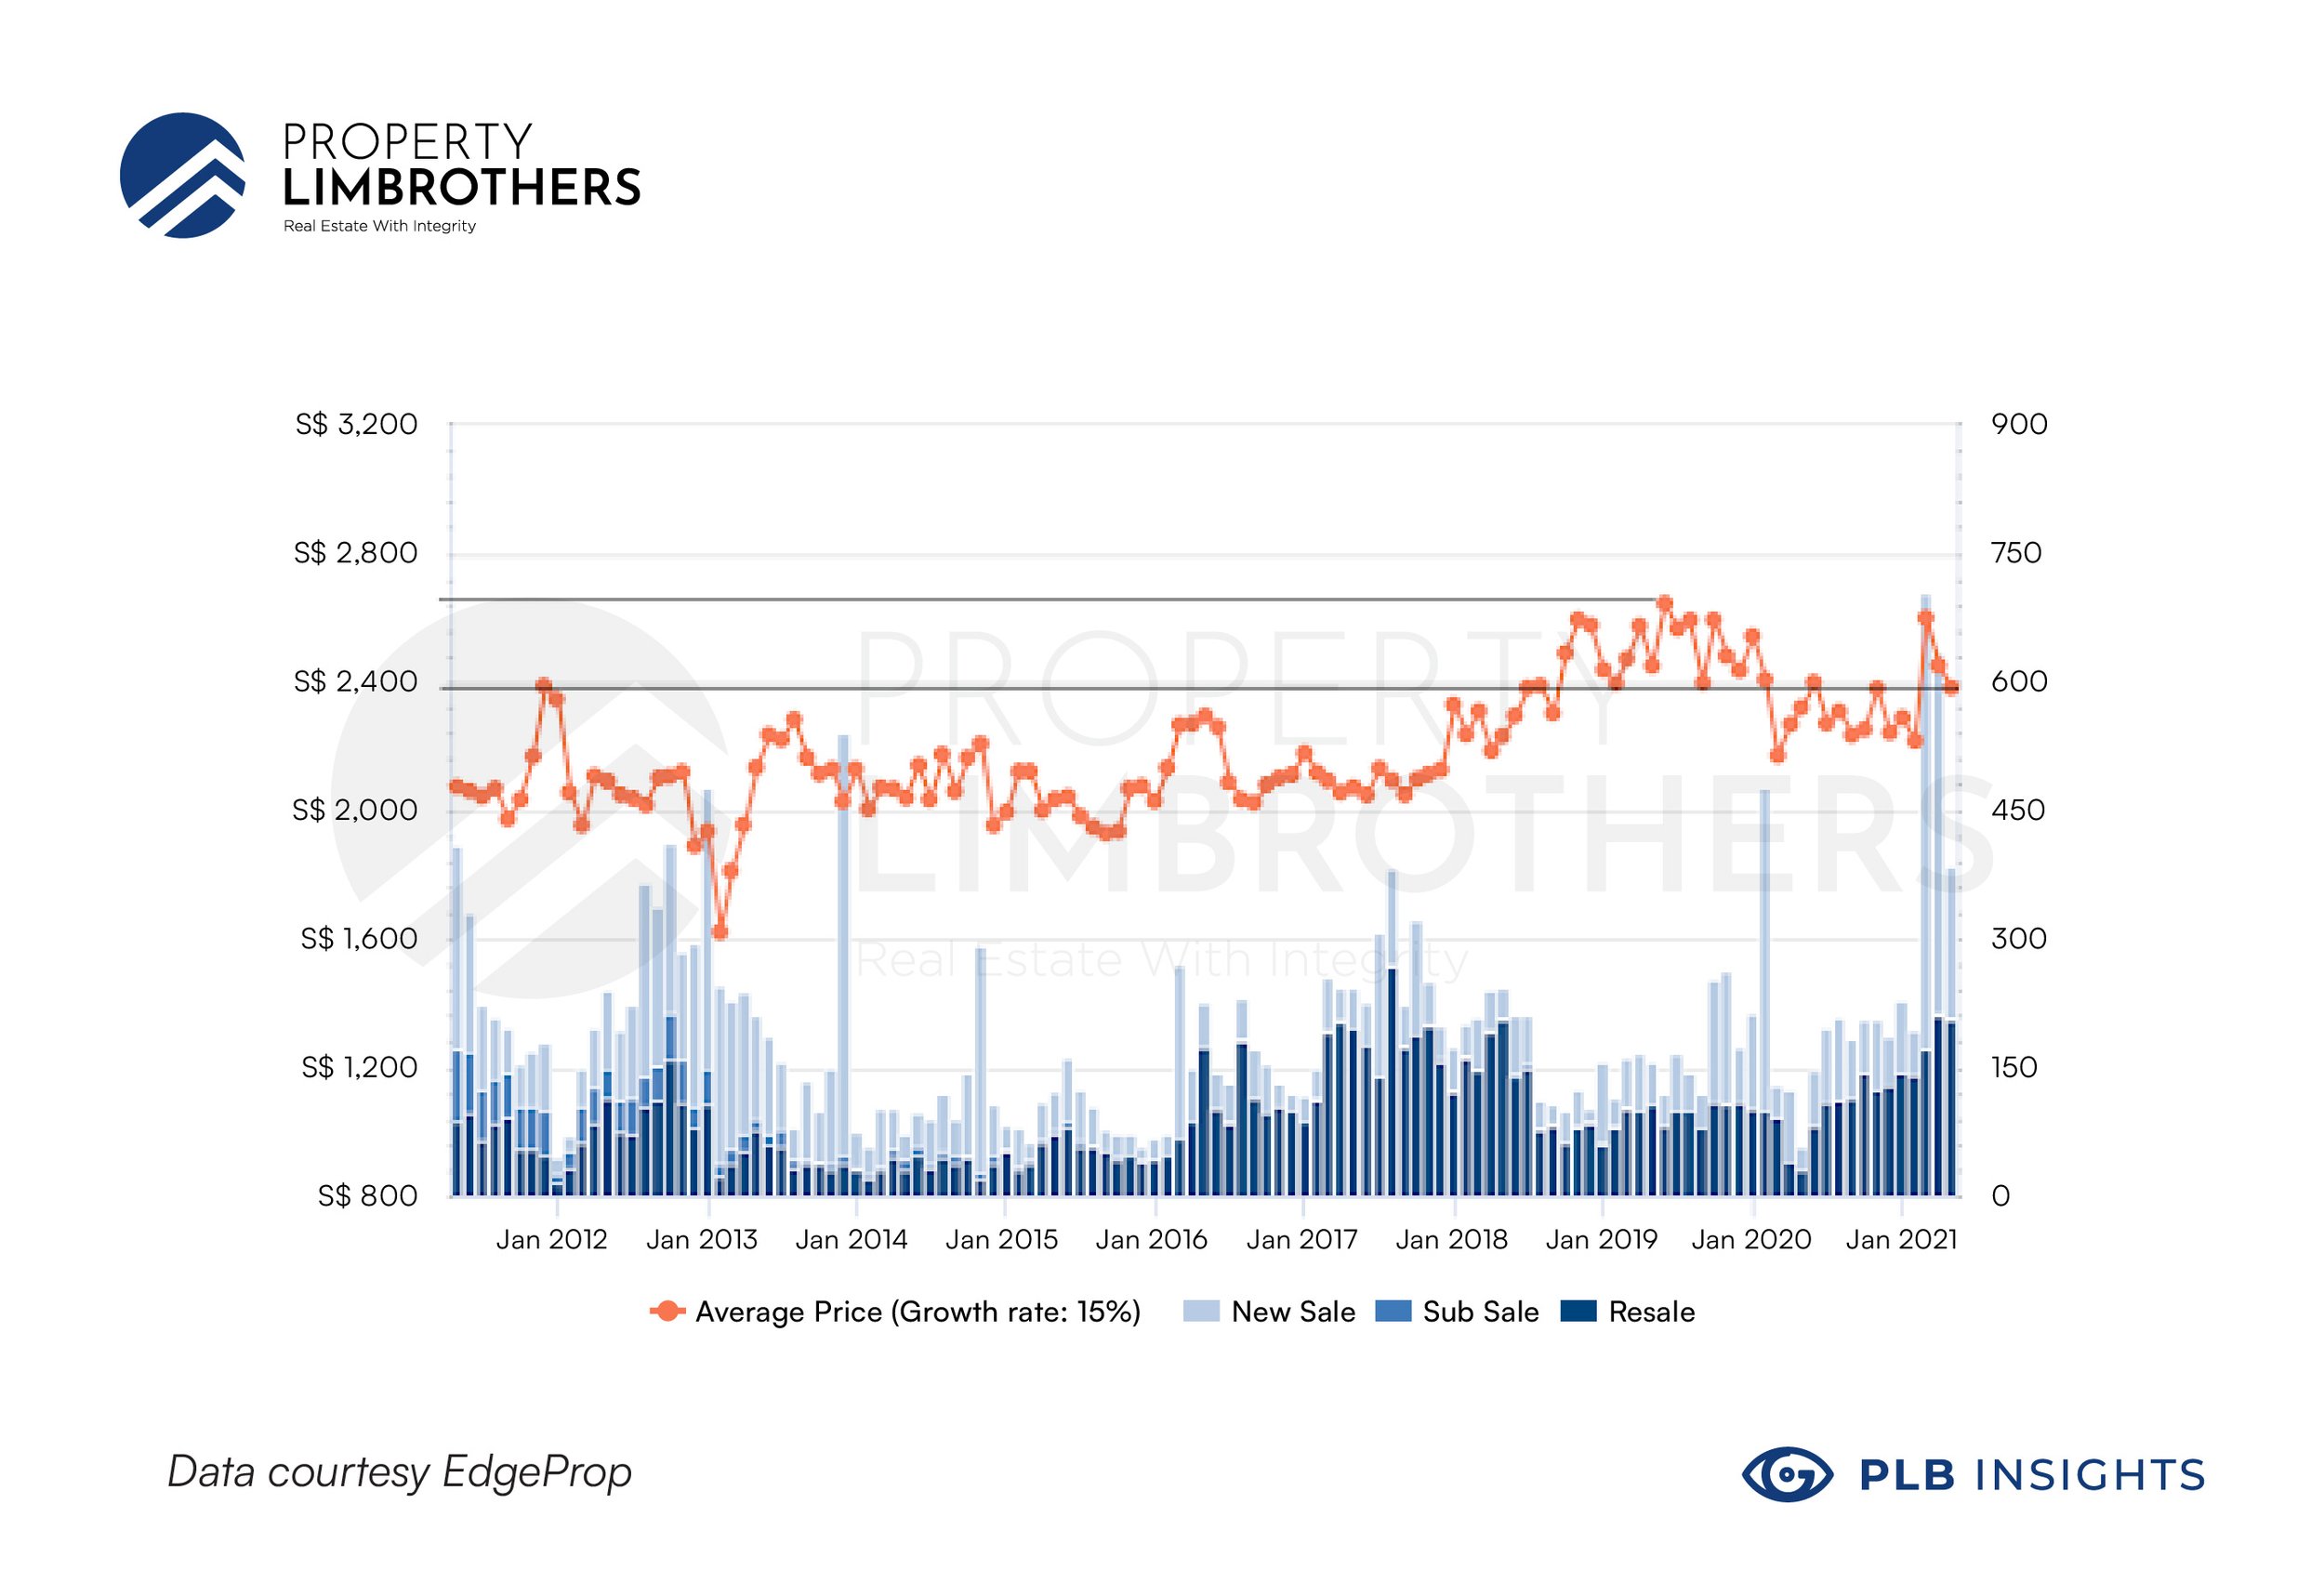
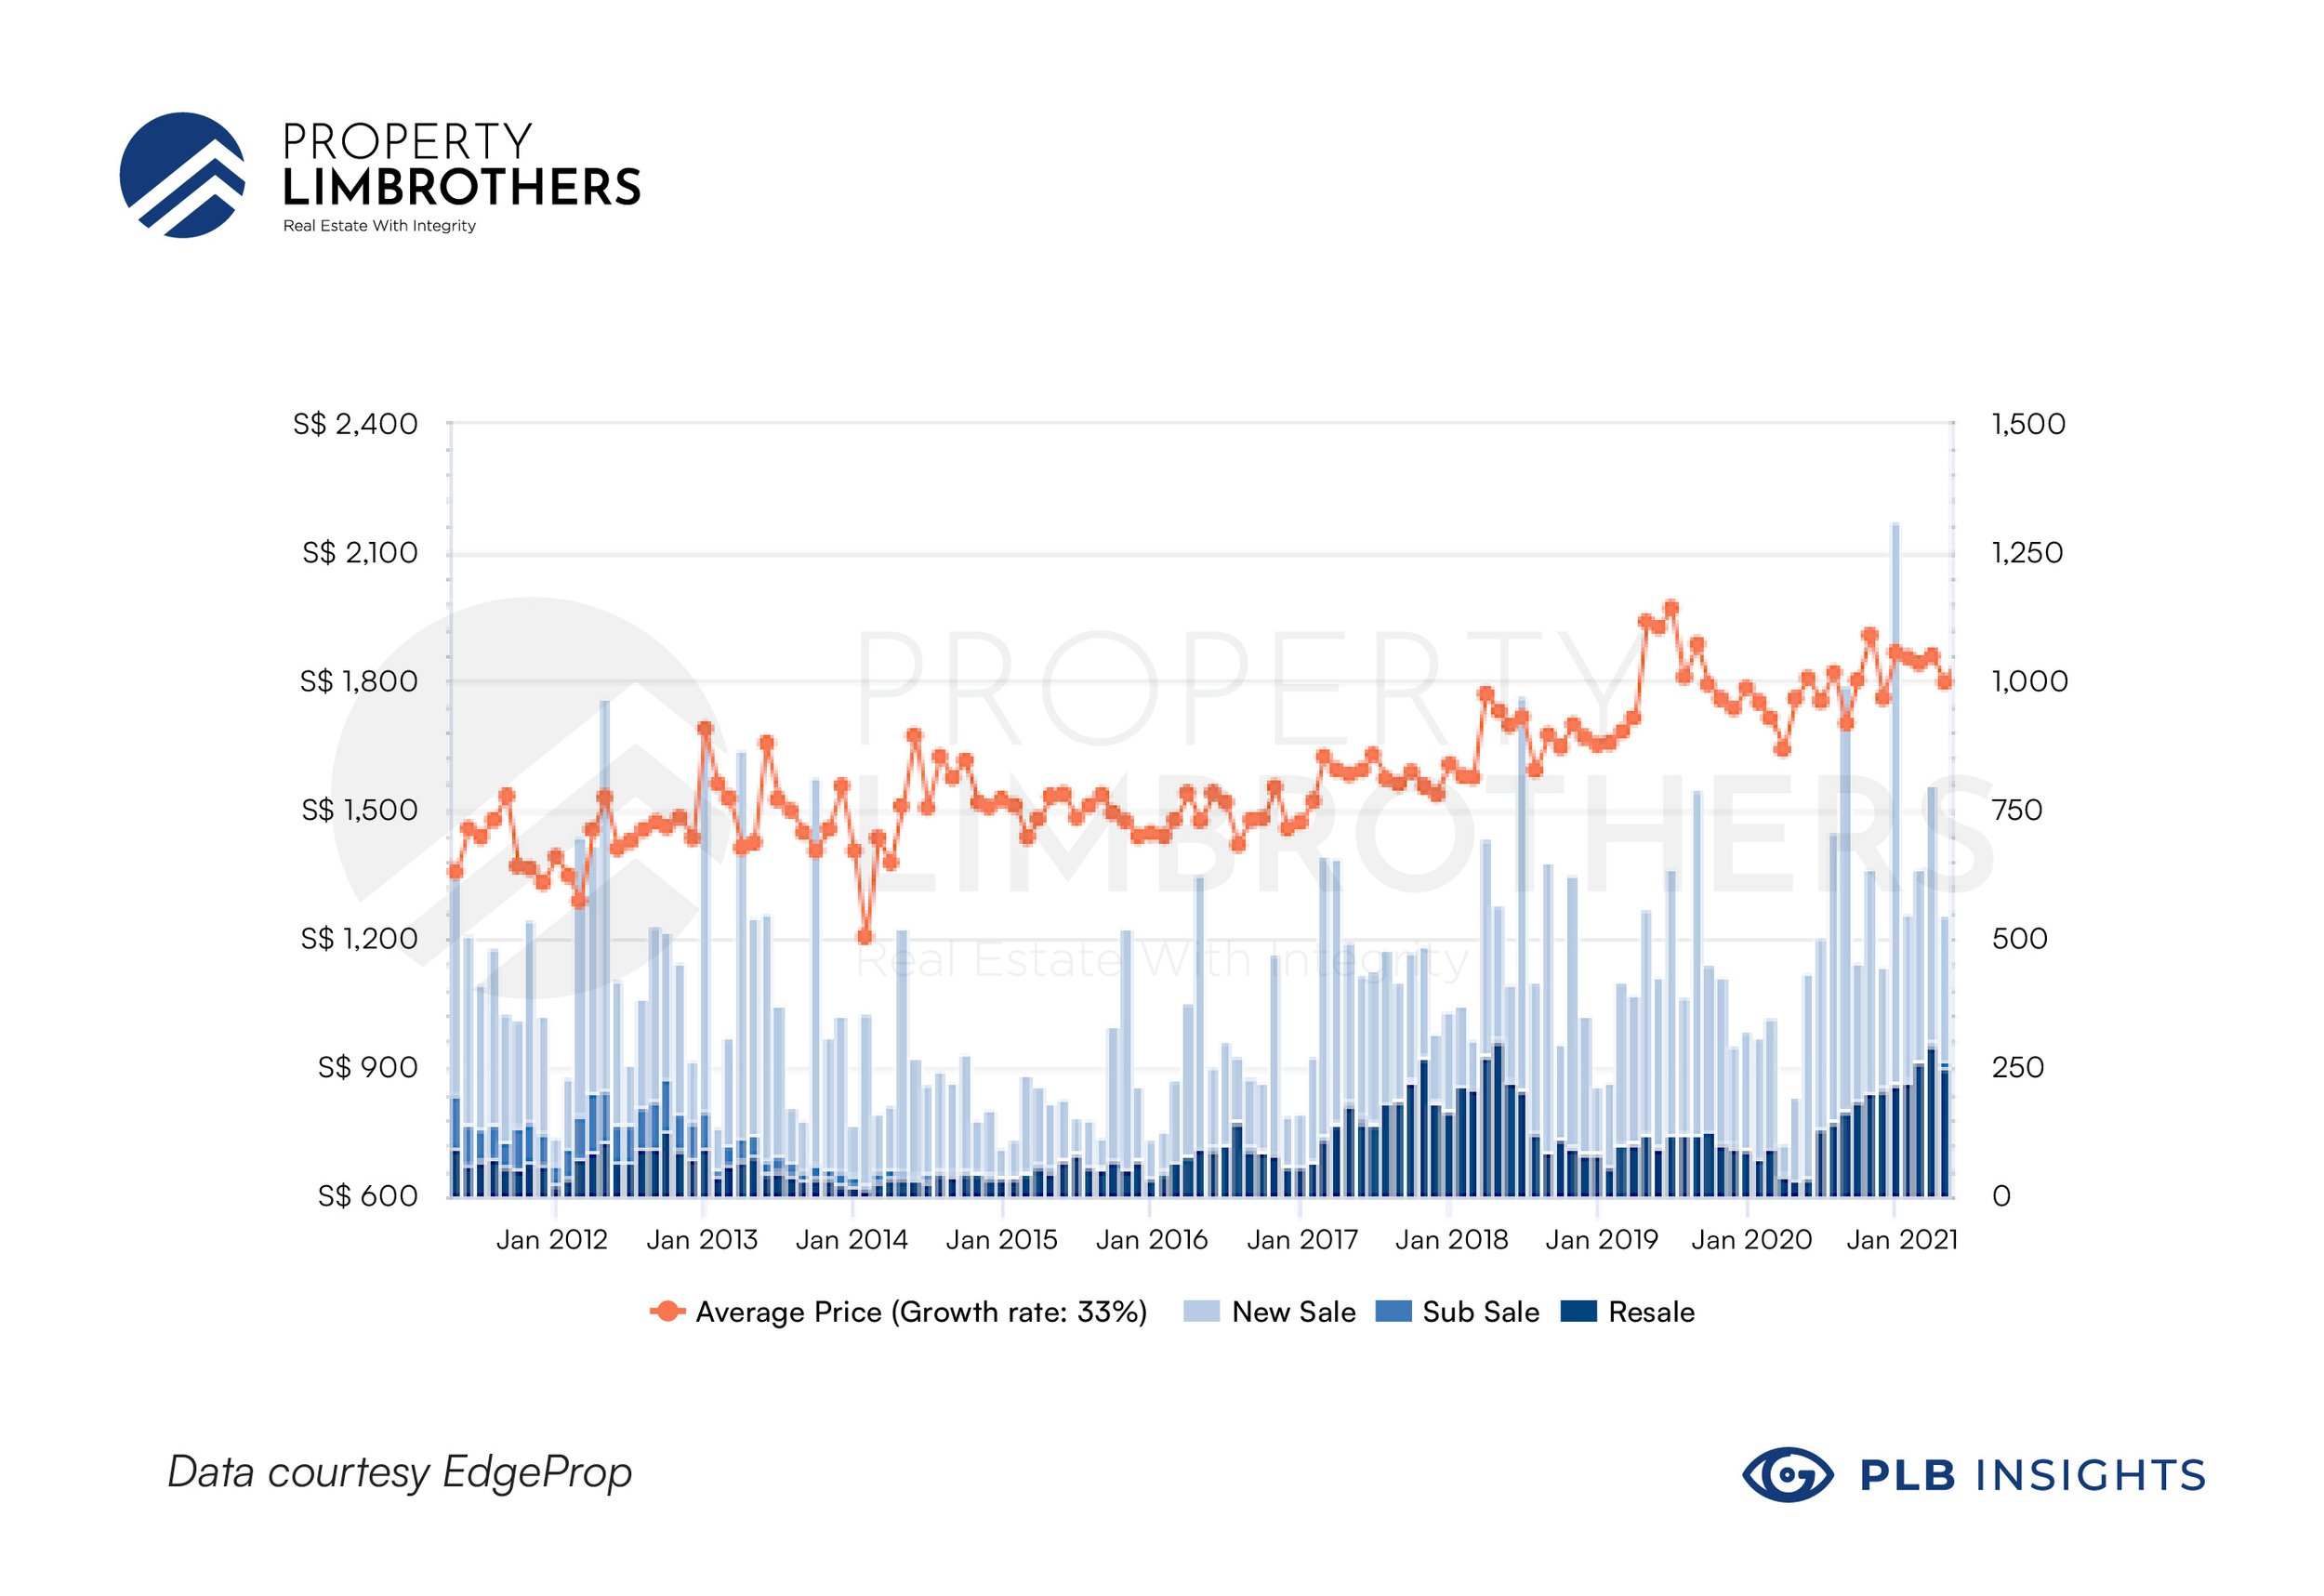
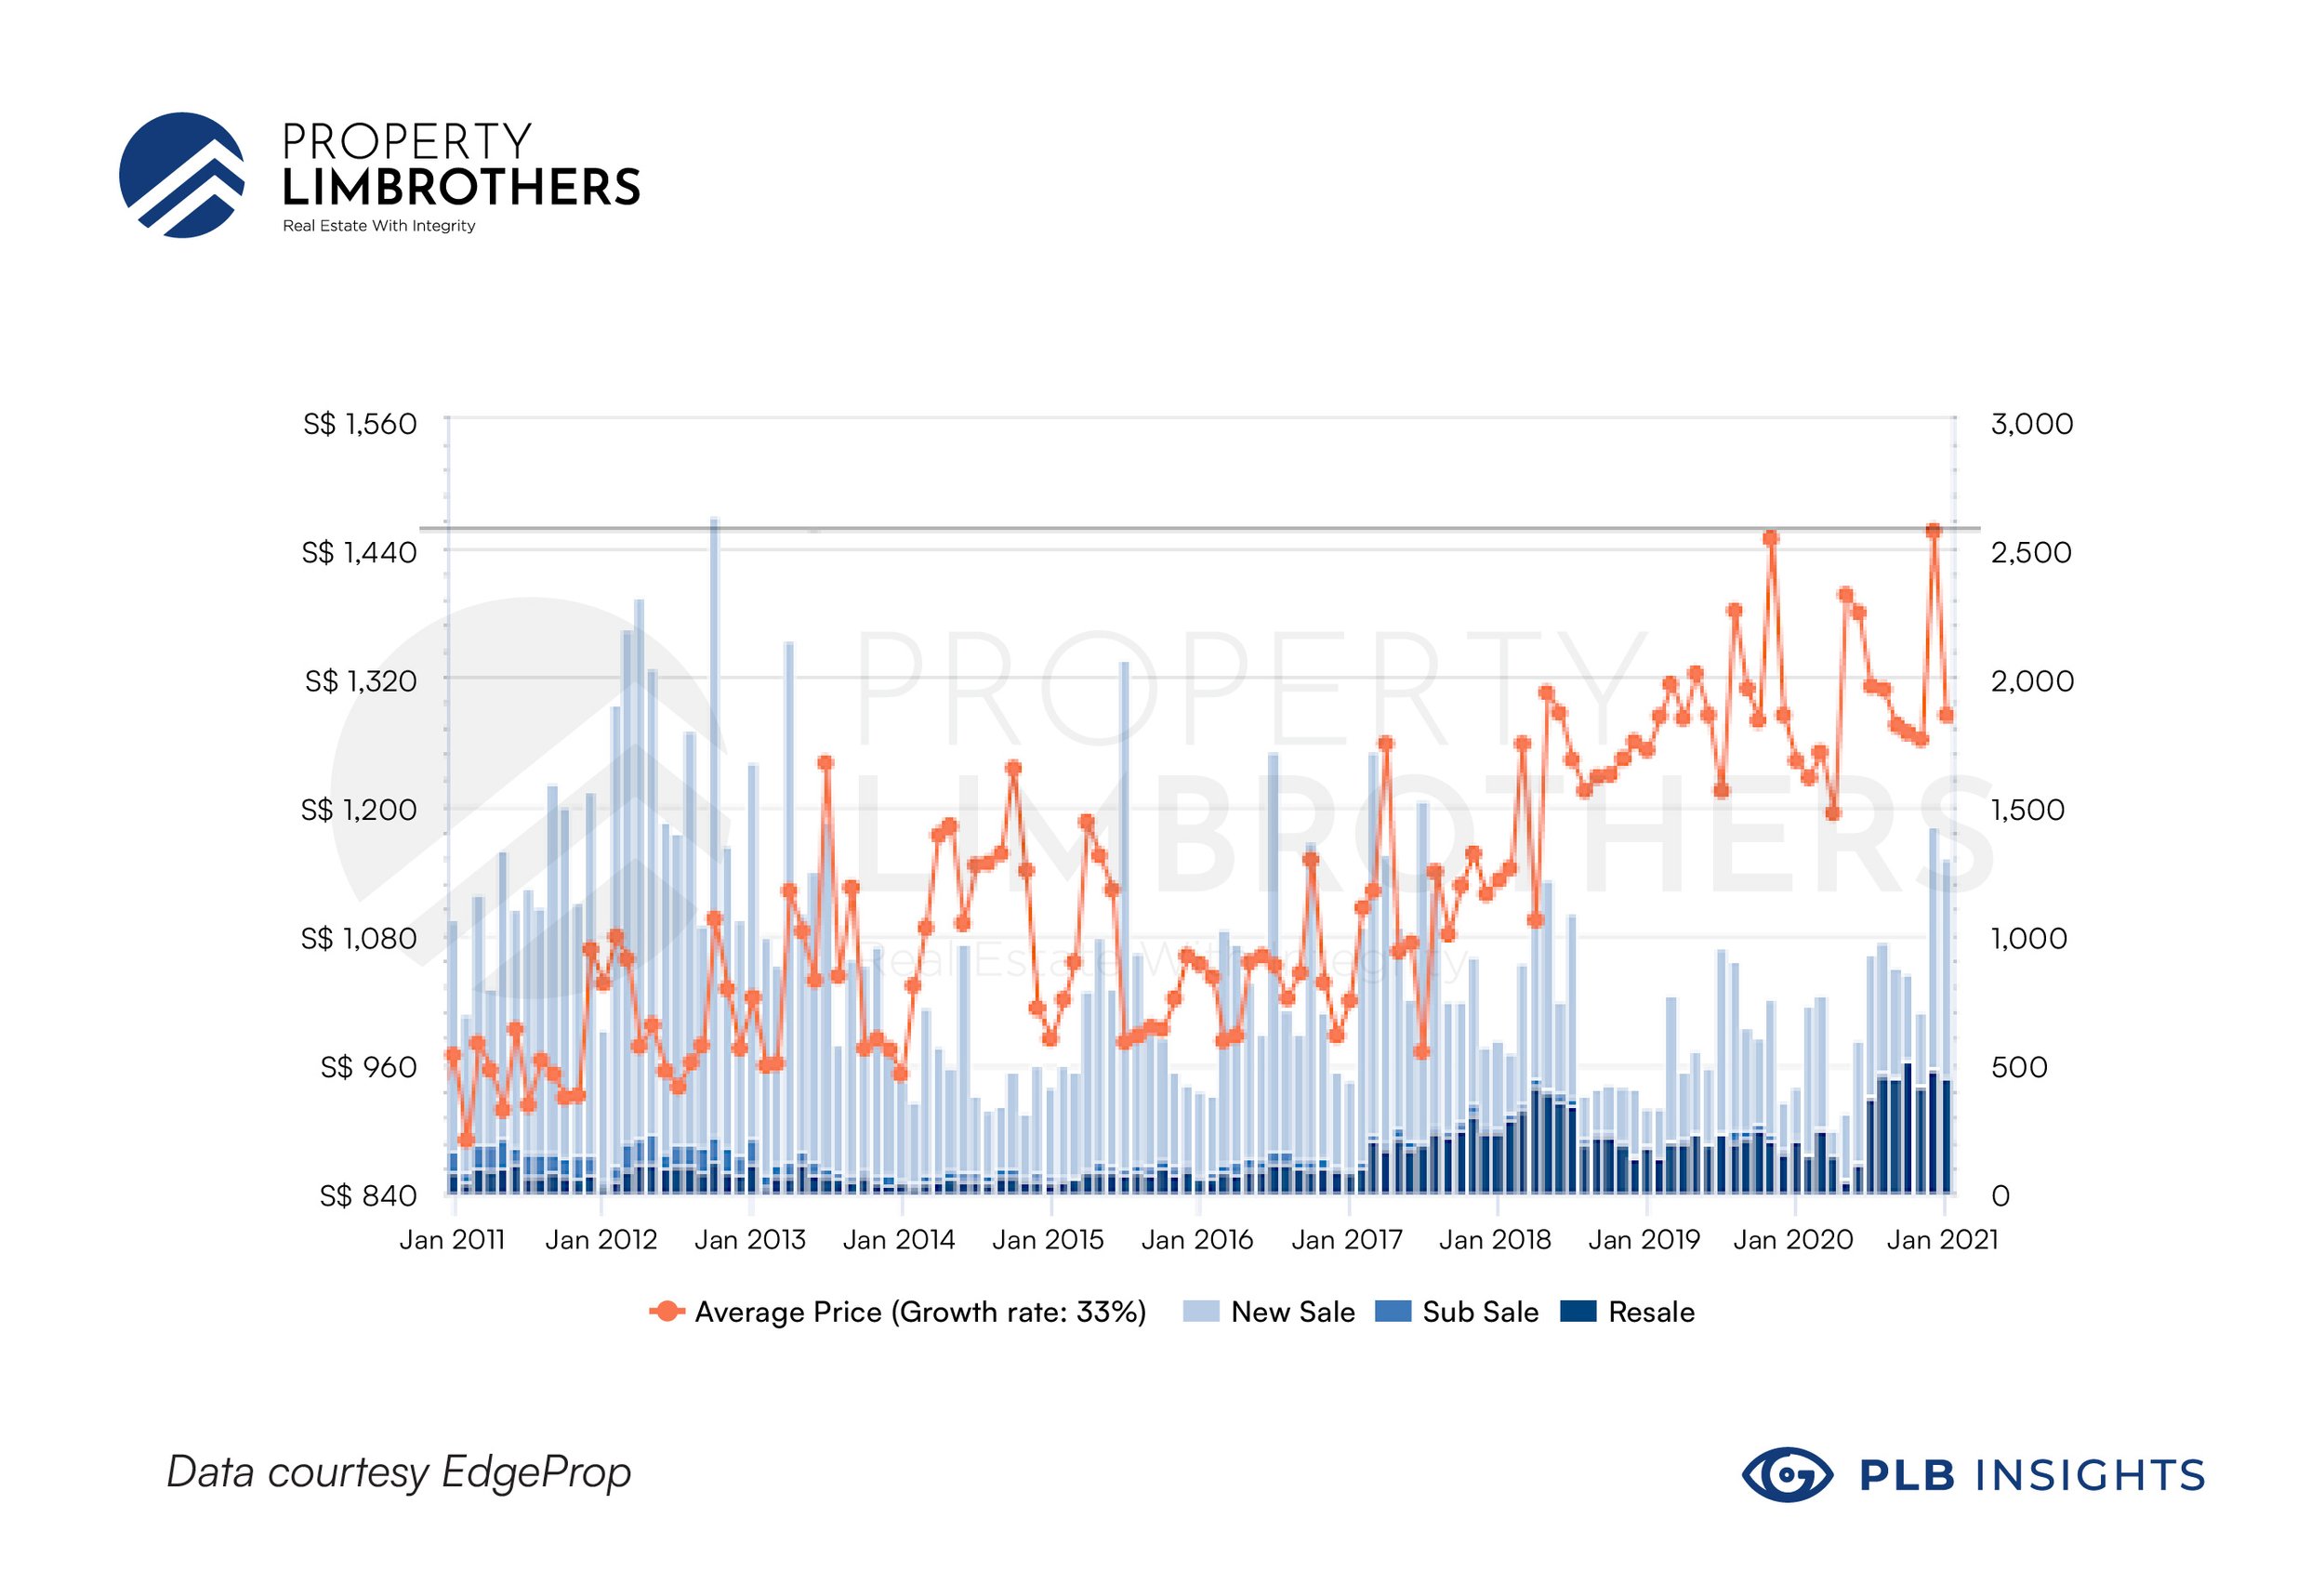
Since 2021, PSF prices of non-landed properties in the Core Central Region (CCR) have been steadily climbing. Interestingly, CCR prices have not risen as fast as its counterparts in RCR and OCR. We think that this is a good sign of pressure building up in the CCR market, ready to push its price upwards.
CCR Non-landed prices (10-year)
RCR Non-landed prices (10-year)
OCR Non-landed prices (10-year)
A simple comparison shows that OCR and RCR prices have grown much faster at 33% compared to CCR prices at 15%. This data could point towards the underlying potential of CCR properties.
Seasonality and price correlations apply across regions as well
The entire CCR market is facing upward pressure from the lower tiers of RCR and OCR. The latter regions have been steadily appreciating prices in the CCR and this will hence nudge the prices in the CCR upwards as buyers try to take advantage of the disparity between the perceived value of the region and the PSF price. Again, the theme of the property market is seasonality, and the RCR and OCR will be nudged up again once CCR prices diverge too much from the rest of the regions.
Foreigners were the main audience for CCR non-landed properties before 2013/ 2018 cooling measures.
In 2012, the government first introduced Additional Buyer’s Stamp Duty (ABSD) for foreign buyers to dampen the rapid price appreciation occurring at the time. This was followed by another round of increase to 15% in 2013, and again in 2018, resulting in the ABSD for foreigners of 15 – 20% depending on how many properties they owned.
This specific measure dampened the overall demand for foreign purchases. CCR properties , which were the most popular amongst foreign buyers, were hit the hardest.
Before these cooling measures, the majority of CCR properties were bought by wealthy foreigners because of the many benefits of the CCR location. Areas like Bukit Timah, Orchard, Newton, and Downtown are known for their proximity to prestigious schools, good F&B locations, and wealthy neighbourhoods. However, the high duties that needed to be paid on top of these already expensive properties were enough to slow down appreciation.
CCR is now a locally-supported market
The introduction of these cooling measures has made CCR properties more attractive and affordable for local buyers. In fact, the trend has shifted towards locals buying the majority of CCR properties, accounting for 89% of the purchases. Having built up a large pool of local buyers and sellers, the CCR market has become self-supporting where the property in CCR will continue to be transacted by Singaporeans.
As such, we see that the CCR market is only now starting to catch up to the price appreciation that OCR and RCR markets have experienced.
Price trends also agree with volume trends
We have seen that volume is picking up for non-landed properties, but what about the price?
Here, we witness even more drastic appreciation in prices, much like what we discussed for the landed property market. Large 3-4 bedroom apartments in the higher quantum range are particularly popular as buyers are considering paying more for extra living space amidst the global pandemic.
This trend of homeowners looking for bigger spaces is not new – we have covered it multiple times across different property classes in both non-landed and landed properties alike. It is also not a trend that will disappear anytime soon given the persistence of the pandemic restrictions and behavioural changes in the population.
In the non-landed segment, families are looking towards units with ground-floor patios, roof-terraces, even additional bedrooms for a more comfortable living experience while working from home.
A caution for trends
The ‘bigger space’ trend is only one of the trends that we have spotted in recent months. There are many other trends that are appearing as this article is being written, which is even more caution for buyers to understand the trajectory of the property they are purchasing.
At a basic level, with any property purchase, buyers should be looking 1-3 years ahead to identify the disparities that will form in the market. Since the seller’s stamp duty is lifted after 3 years, short-term flipping is not as favourable. Hence, buyers need to be certain that their property will remain attractive years down the road.
An important saying to keep in mind is that buying a property is easy, but selling it is much harder. There needs to be a match between what the market is looking for and what your property is offering, much like customer and product. If you can show that your property fits what the market wants at the moment, higher prices can be commanded from a large pool of interested buyers.
Seasonal price movements are not the same as predictable price movements.
Naturally, we are attracted to seasonalities because it suggests that there is a way to time the market. However, we strongly advise against timing the market because unlike more liquid assets like stocks and bonds, real estate time frames are measured in years, and the runway for real estate investing is short. A single mis-timing can set back your entire real estate journey by years while you wait for the costly Seller’s Stamp Duties to be lifted.
While we observe patterns and correlations between property types and even entire regions, the property market as a whole can move up or down depending on many conditions that are impossible to predict. Geopolitical events, economic conditions, and market sentiment can change suddenly and put one in a bad spot that is difficult to recover from.
For the average Singaporean who starts saving for a house at age 25, there are only about 4-5 cycles of property buying and selling before hitting the age of 65 where real estate purchases become much more restrictive. Thus, it is all the more important to be prudent about minimizing the risks on such high-value asset purchases.
Leverage your time as a resource rather than spend it waiting for the right moment to buy
By timing the market, one gives up the opportunity cost of time. It is possible that waiting out the market for a lower price to buy in may net buyers a greater appreciation in value. However, buyers who do so start their real estate journey later, which compounds into less leverage over the loans that ultimately finance their home purchases. Age is a major factor in loan tenure, amounts, and repayment schemes, which all affect a buyer’s monthly cash flow.
More importantly, timing the market puts buyers at risk of being priced out of the market should the price continue to appreciate. The remaining properties that are available may end up being less attractive to the future buying audience. Even worse, the buyer themselves may settle for a property that they do not really understand just to quickly get into the market.
The solution? Work with data to identify opportunities in specific districts and property types. This way, one does not need to bank on the entire market moving towards their favour. Basic price research is something that everyone can and should do. It also helps that the tools for research are readily available and provide comprehensive data on the major trends in the market.
Research data is only useful if it is accurate.
Earlier, we mentioned the use of public portals for research into price trends of specific properties. These methods do have their merits in that they are convenient to use and require little effort and cost. However, even reported data is usually outdated by a few months. One should never assume the accuracy of these reports as outdated data is more detrimental than useful.
First, not all transactions are reported – real estate transactions have the option to file a caveat. This is where the buyer and seller agree on the price of the property and place a freeze to stop any other transactions with interested buyers. Only in such situations do transacted prices become public. In other instances where buyer and seller have no need for such legal protection, transaction prices are unknown, resulting in less information available.
After the caveat is agreed upon and the transaction price fixed, more time is required for tasks such as negotiating the options period, exercising the option, paying of duties, and the actual filing of the caveat with the URA. This can take anywhere from weeks to months depending on the complexity of the negotiations. Thus, pricing data reported publicly can differ greatly from real-time price sentiments from buyers and sellers. Having slow data streams is especially dangerous in the current fast-moving market since one can get the wrong impression by looking at old data.
To combat this, buyers must engage with property owners on the ground to learn about the current asking prices and compare them with the transaction data that are publicly available.
Leave the hard work to us
This article has been a long one. From breaking down the market trends in the non-landed market, analysing district specific trends, zooming into the CCR region to posit why it has yet to reach its potential, as well as taking you through this price movement analysis; this is the process that our buyer consultants do when we are researching properties for our clients. We understand that this is not only the most crucial part of spotting disparities in real-time, but it is also the hardest part. If you need an expert opinion, we are always available to lend you our services so that you can have a fulfilling real estate journey.


