In a fast-paced society we live in today, many are looking for ways to grow their assets, and investment is one of the many roads towards it. However, investments are double-edged swords, and the choices we make during an investment will affect its benefits or whether it serves or harms us.
Investing in the real estate market can be quite a headache sometimes as there are many factors which can affect the outcome. Be it the types of properties or which district they are located in, these are just some of the factors that play a part in the investment value of properties in the real estate market.
In this article, we are going to analyse and explore in detail more on the different areas, districts and condos through past trends and elaborate more on how to maximise your profits from your investment choices.
CCR, RCR and OCR

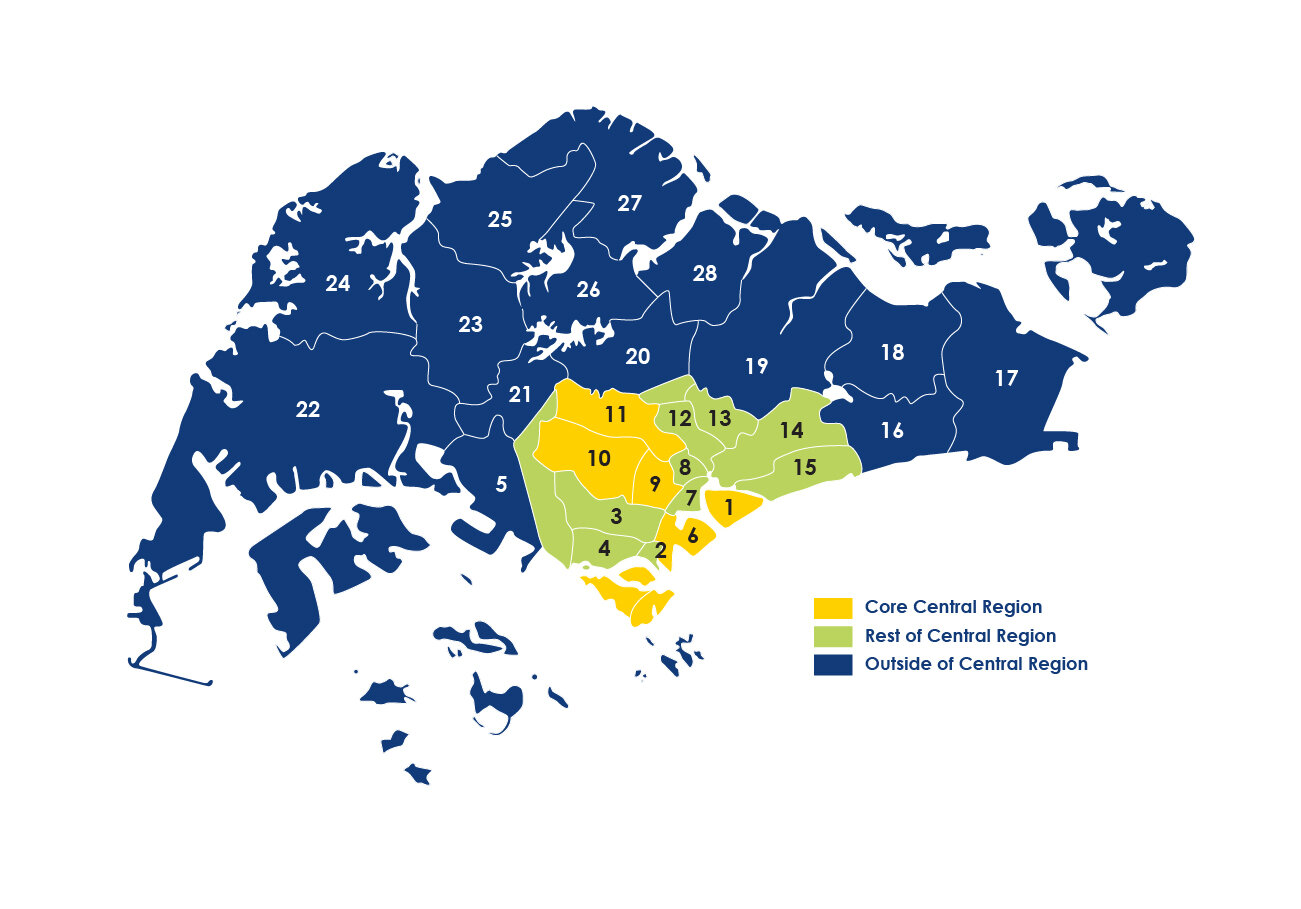
Before we even dive into the details, let’s take some time to understand how real estate is segregated in the market. Singapore is split into 28 districts, and these districts are categorised into three regions, namely the Core Central Region (CCR), the Rest of Central Region (RCR) and the Outside of Central Region (OCR).
The CCR consists of districts 01, 02, 06, 09, 10 and 11. Known to be very near the Central Business District (CBD), the CCR is known to be the heart of Singapore. Districts 02, 03, 04, 07, 08, 12,13,14 and 15 are part of the RCR. These districts lie right outside the districts of CCR, sandwiched before the districts in the OCR. The rest of the districts form the OCR, which is more than 70% of the entire area in Singapore.
Past Trends
*The data in the tables derived from 99.co is for the period between January 2012 to June 2021.
Sales trends
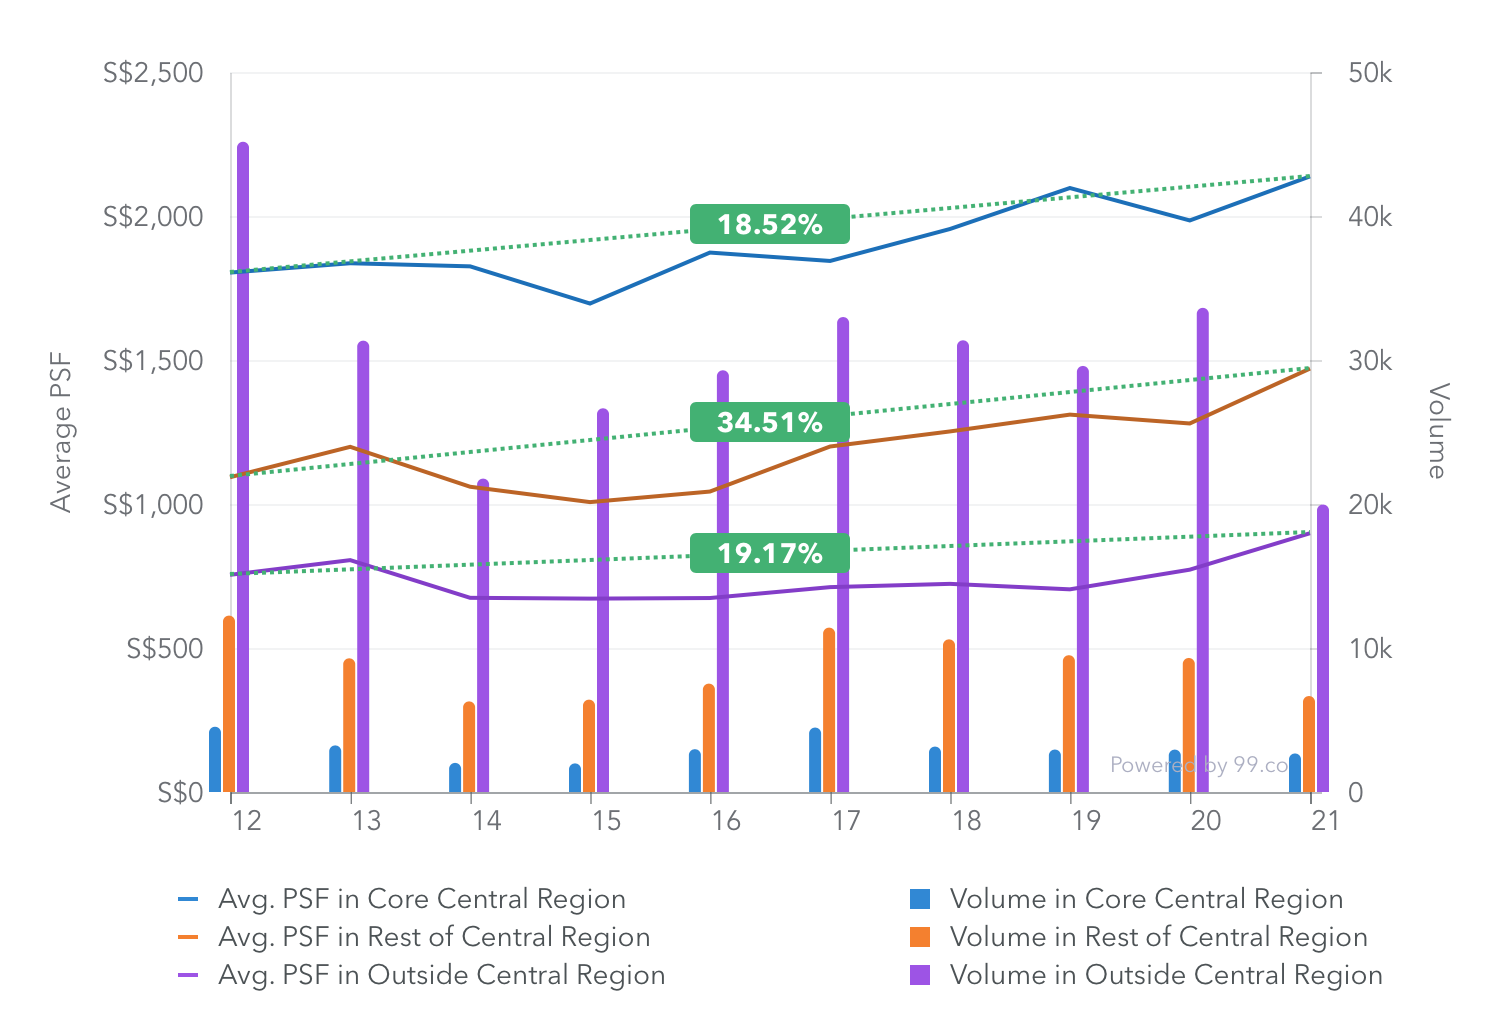
The prices of properties are partially dependent on the types of properties as well as the districts and regions they lay in, and this can be inferred from the past trends. Comparing the average PSF prices of the properties in the various regions, it is observed that the average PSF price of the properties in CCR is significantly higher than that of those in RCR and OCR.

Graph derived from 99.co
Comparing the percentage increase of the average PSF of properties in the various regions however, the average PSF of the properties in RCR increased the most by 34.51% as compared to those in CCR and OCR. The increase in average PSF for properties in OCR comes in second at 19.17%, while that of the properties in CCR increased by only 18.52%.
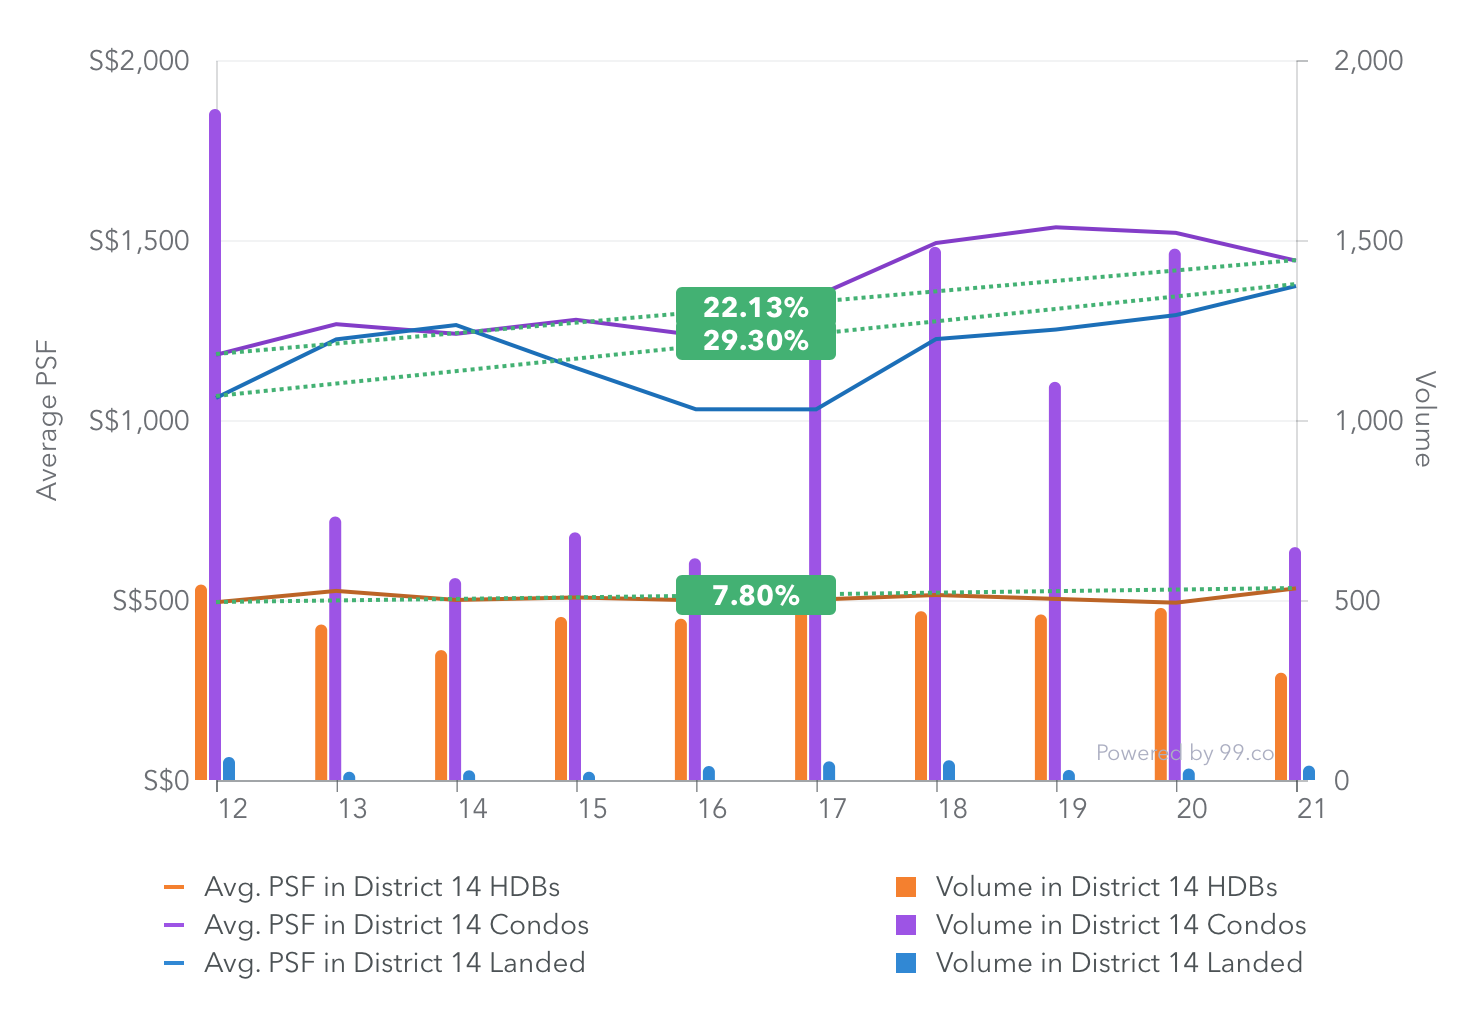
However, the type of properties also play a role in their pricing. Take for example the properties in District 14, if we were to compare the average PSF price of these properties, the average PSF price for the HDBs is the lowest, followed by landed properties while the average PSF price for condominiums are the highest.

Graph derived from 99.co
Comparing the percentage increase in average PSF price, it is the most for landed properties with 29.30% increase, while the percentage increase for the average PSF price for condominiums is relatively close at 22.13%. There is an increase in the average PSF price for HDBs at 7.80%, but compared to the percentage change for condominiums and landed properties, the price appreciation for HDBs isn’t as high.

Graph derived from 99.co
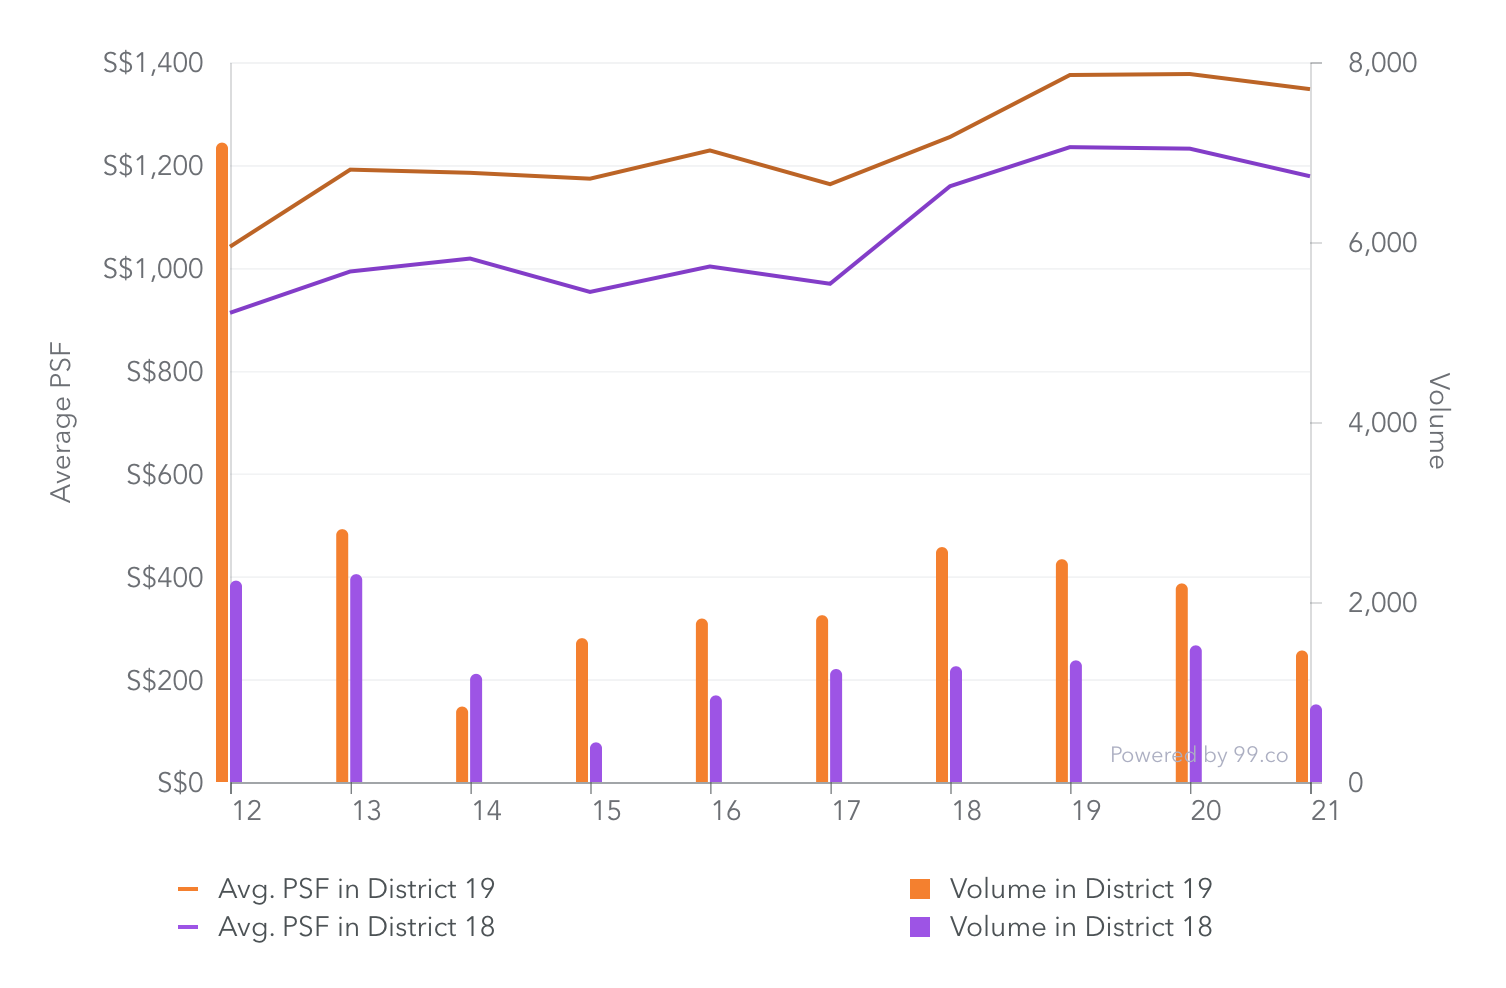
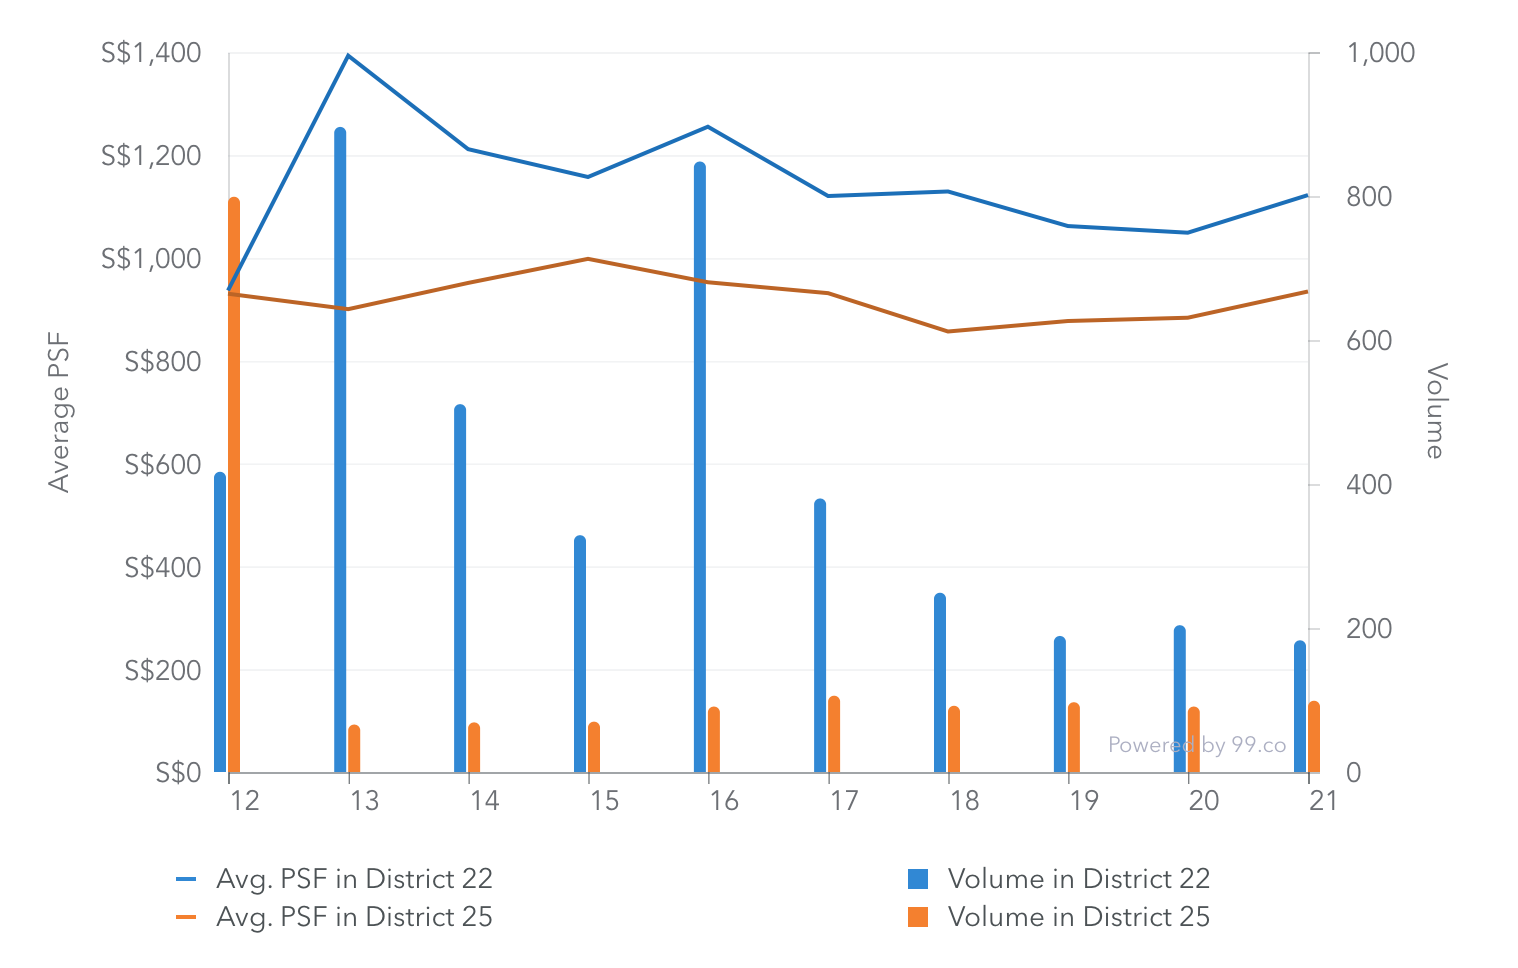
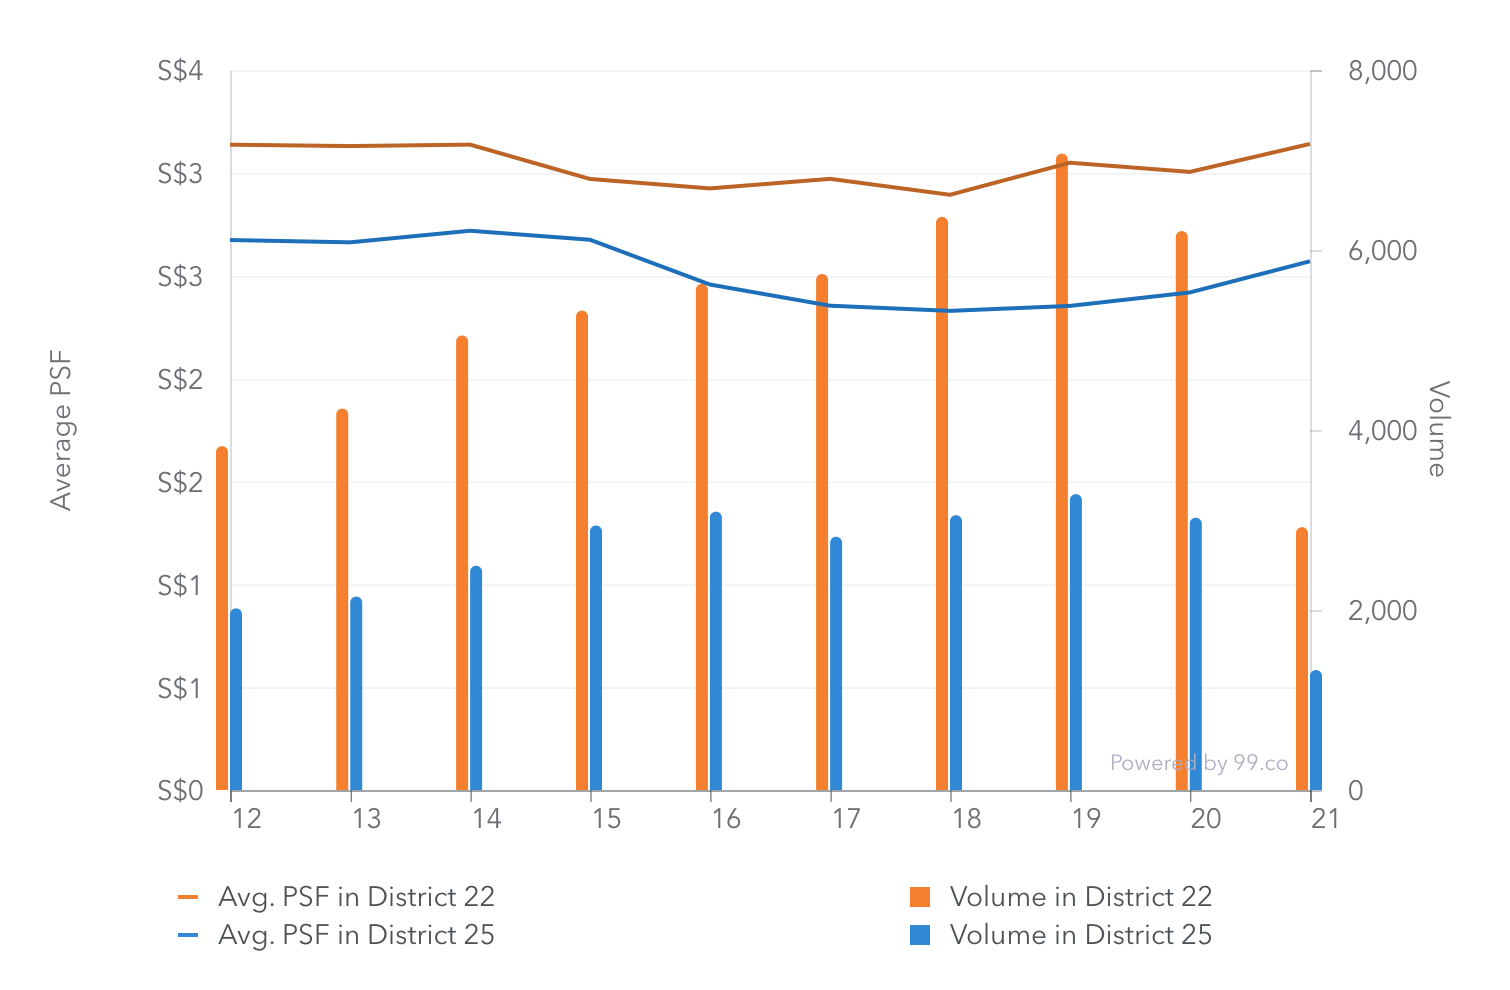
And lastly, if we were to compare properties in different districts of the same region we can see the differences in pricing as well. For example, the average PSF price of properties in District 19 is higher than that of those in District 18. Another example is when we compare District 22 and District 25. Comparing these two districts, the average PSF price of properties in District 22 is higher than that of those in District 25.

Graph derived from 99.co
Properties in different districts tend to be priced differently although they belong in the same region depending on a few factors like the accessibility of the district to industrial or commercial nodes like the CBD, the district’s maturity, the average age of the properties in it and the future potential within or nearby the districts.
Rental trends
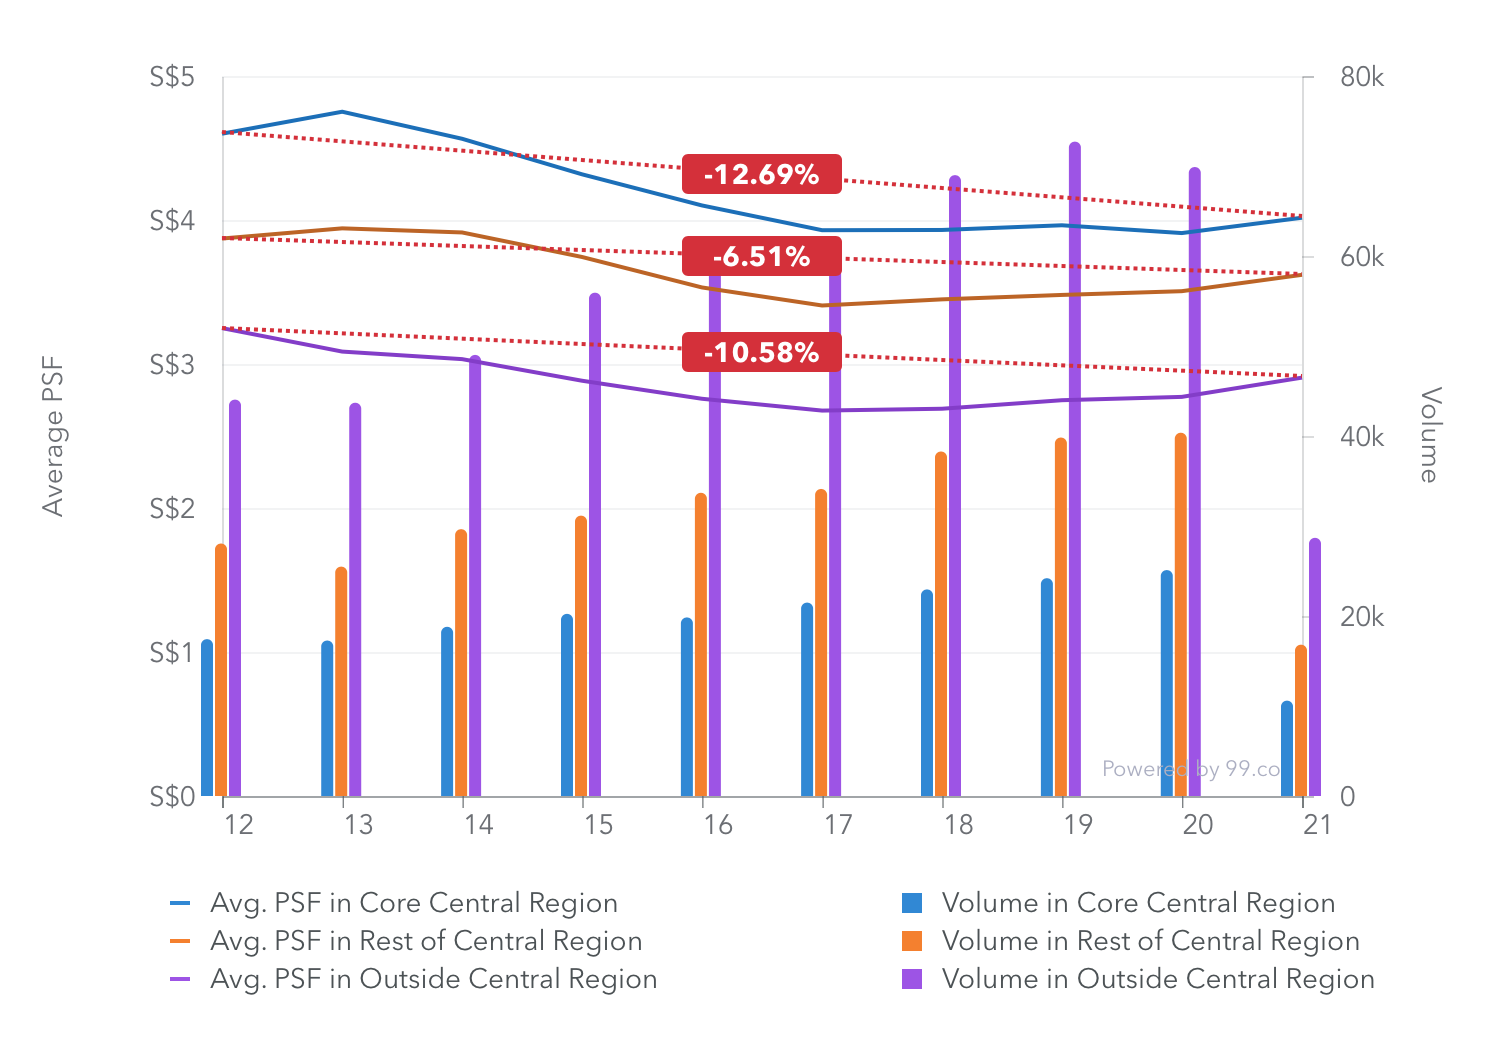
Rental demand works a bit differently from sales demands, hence the factors that affect rental demand would be slightly different from that of sales. Rental demand mainly goes to permanent residents, long-term pass holders as well as international students, hence these groups will tend to rent in areas that are in proximity to their schools or workplace.

Graph derived from 99.co
These areas are typically within or around CBD, which belongs in the CCR and RCR. The difference in the rental demands and the rental rates can be seen if we were to compare them. The rental rates for the properties in CCR is the highest, followed by that of the properties in RCR and lastly OCR. However, comparing the percentage change of the average rental PSF of the properties in the various regions, the average PSF of the properties in RCR changed the least by 6.51% as compared to those in CCR and OCR. The change in average PSF for properties in OCR came in second lowest at 10.58%, while that of the properties in CCR changed by 12.69%.

Graph derived from 99.co
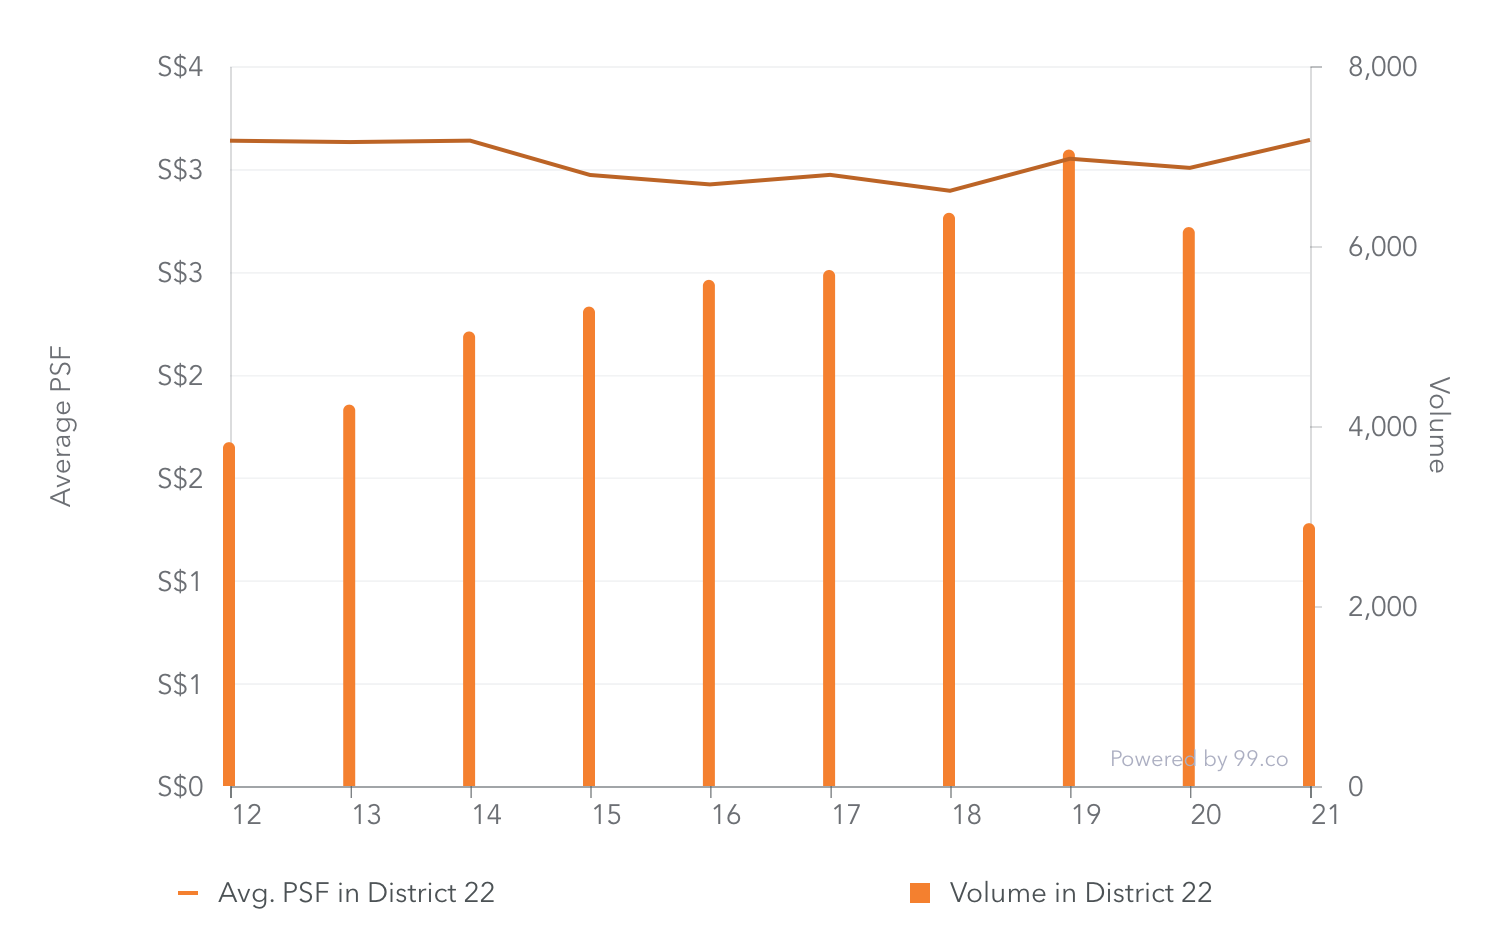
However, there are also districts in OCR that yield higher rental demand as well. For example, District 22 (OCR) has had increasing rental demand since 2012, and if we were to compare it with the rental demand in District 25 (OCR), it is definitely much higher than that of District 25. Taking a look at the Singapore map, District 22 is in closer proximity to industrial areas as compared to District 25.

Maximising investments through price appreciation and rental yield
The value of properties vary, and in terms of investment in the real estate market, price appreciation and rental yield play a huge role in the value. The concept of price appreciation is common in investment, whereby investors would want to position their money in things that are a good store of value. A good store of value, in dictionary terms, is an asset that maintains its value, rather than depreciating.
Hence, if we are looking at properties, we want to look for properties that have a higher chance of better price appreciation and hence having a “good store of value”. This is where the search for potential properties is usually linked to past sales trends amidst other factors. Depending on the type of property, the district it lays in and the region it is nestled in, we understand from past trends that these factors influence the potential price appreciation of properties.
For rental yield, this is a concept whereby we are letting our assets reap to pay off liabilities, such as mortgage loans. In simpler terms, the amount earned from rent is able to help pay off outstanding loans on hand, which eases the financial burden we might possibly have while at the same time maximising the gains from the property.

Graph derived from 99.co
Of course, it is not every day that you find people looking to rent a room or a flat, so it will be wise to study rental trends and the upcoming business areas to spot where the rental demand will flock to. This is so that there are higher chances of having someone actually renting your unit. Normally, areas that are popular for rent are usually accessible to CBD and industrial areas, with District 18 being a good example. Although the district is located within OCR, the rental demand has been on a rise because of the district’s accessibility to Changi Airport and the Changi North Industrial Park.
We also have to note that at the end of the day, there’s an increasing number of properties in the real estate market, which also means that in terms of rental, there are more options for people to choose from. Hence, it would also be good to look out for the percentage change in the rental prices to observe which region or areas are subjected to more changes.
Another main thing to look out for is the current status of other markets other than just the real estate market, or in short, the performance of the economy. Taking a second look at the trends, it is noticeable that the demand for properties and for rental either remained stagnant or decreased in the year 2020, which was when the pandemic hit. So while many would claim that property is a stable form of investment, it still wavers based on market sentiment.
But what came together with the pandemic is lower interest rates, which would mean that mortgage loans would be slightly more affordable. Also, with the pandemic, many expatriates tend to downgrade the areas they are renting due to the companies cutting costs on employee benefits, which can be seen from the trend of movement from CCR towards RCR and OCR. This led to an increase in the demand for RCR and OCR properties even though they are not as accessible to CBD.
Exit Strategy
Investment is a long term commitment which requires a lot of careful planning. Many a times people start planning how and when to enter a market, but not when to exit. Maybe it’s because they feel they can plan their exit after entering the market, but let’s be honest, it can be quite a dangerous move. After all, exiting a market is still part of an investment journey, and it’s a wiser move.
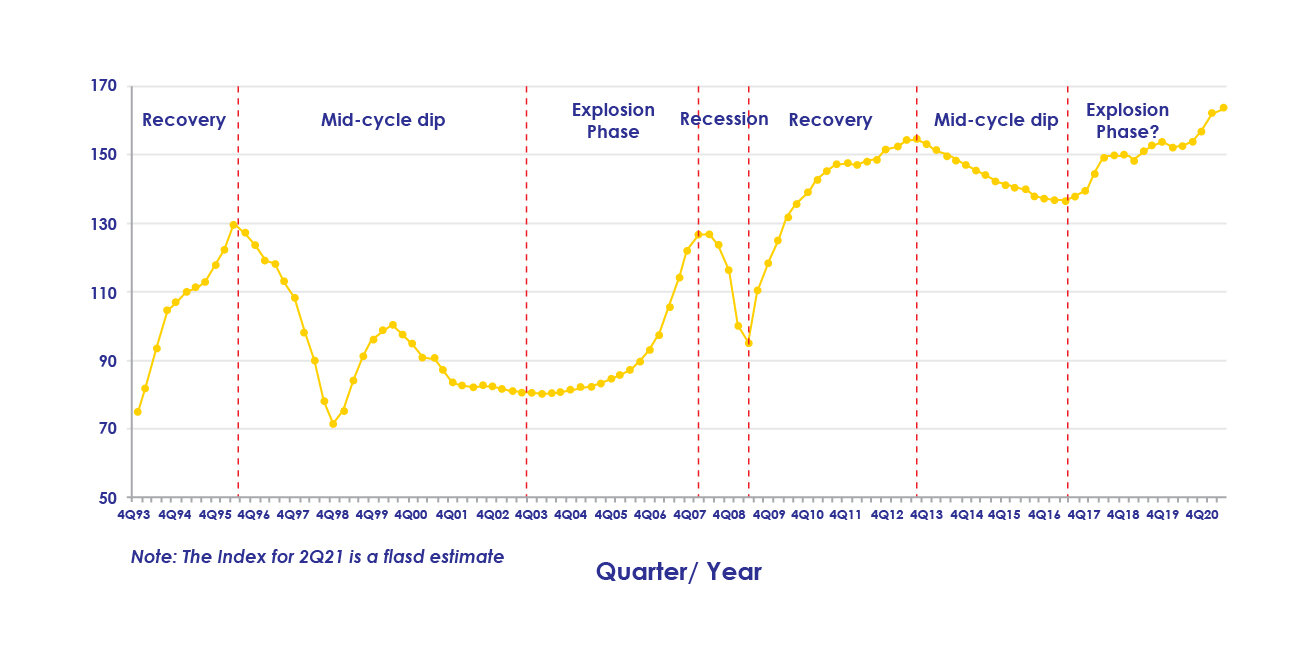
Hence, before planning anything, it is good to study the market. Homer Hoyt, an American economist, is the first to discover that a property cycle happens in 18-year cycles. There are four main phases in the 18-year property cycle, namely the Recovery phase, the Mid-cycle Dip, the Explosive Phase, and the Recession Phase.

Data source URA
The Recovery phase, which takes place after the Recession phase, is when investors’ confidence in the real estate market slowly returns for around six to seven years. With the lower prices for real estate, this makes it a buyers’ market in which investors who are financially stable and cash rich will be tempted to enter the market.
The next phase, which is the Mid-cycle dip, is when more investors start to enter the market. Usually during this period, the investors who entered the market earlier in the Recovery phase will tend to cash out. Maybe it’s because they feel that another recession is coming soon, or maybe they would prefer to play safe and withdraw when they feel that they have profited enough to cash out. But for whatever apparent reason, the confidence in the real estate market is still apparently strong.

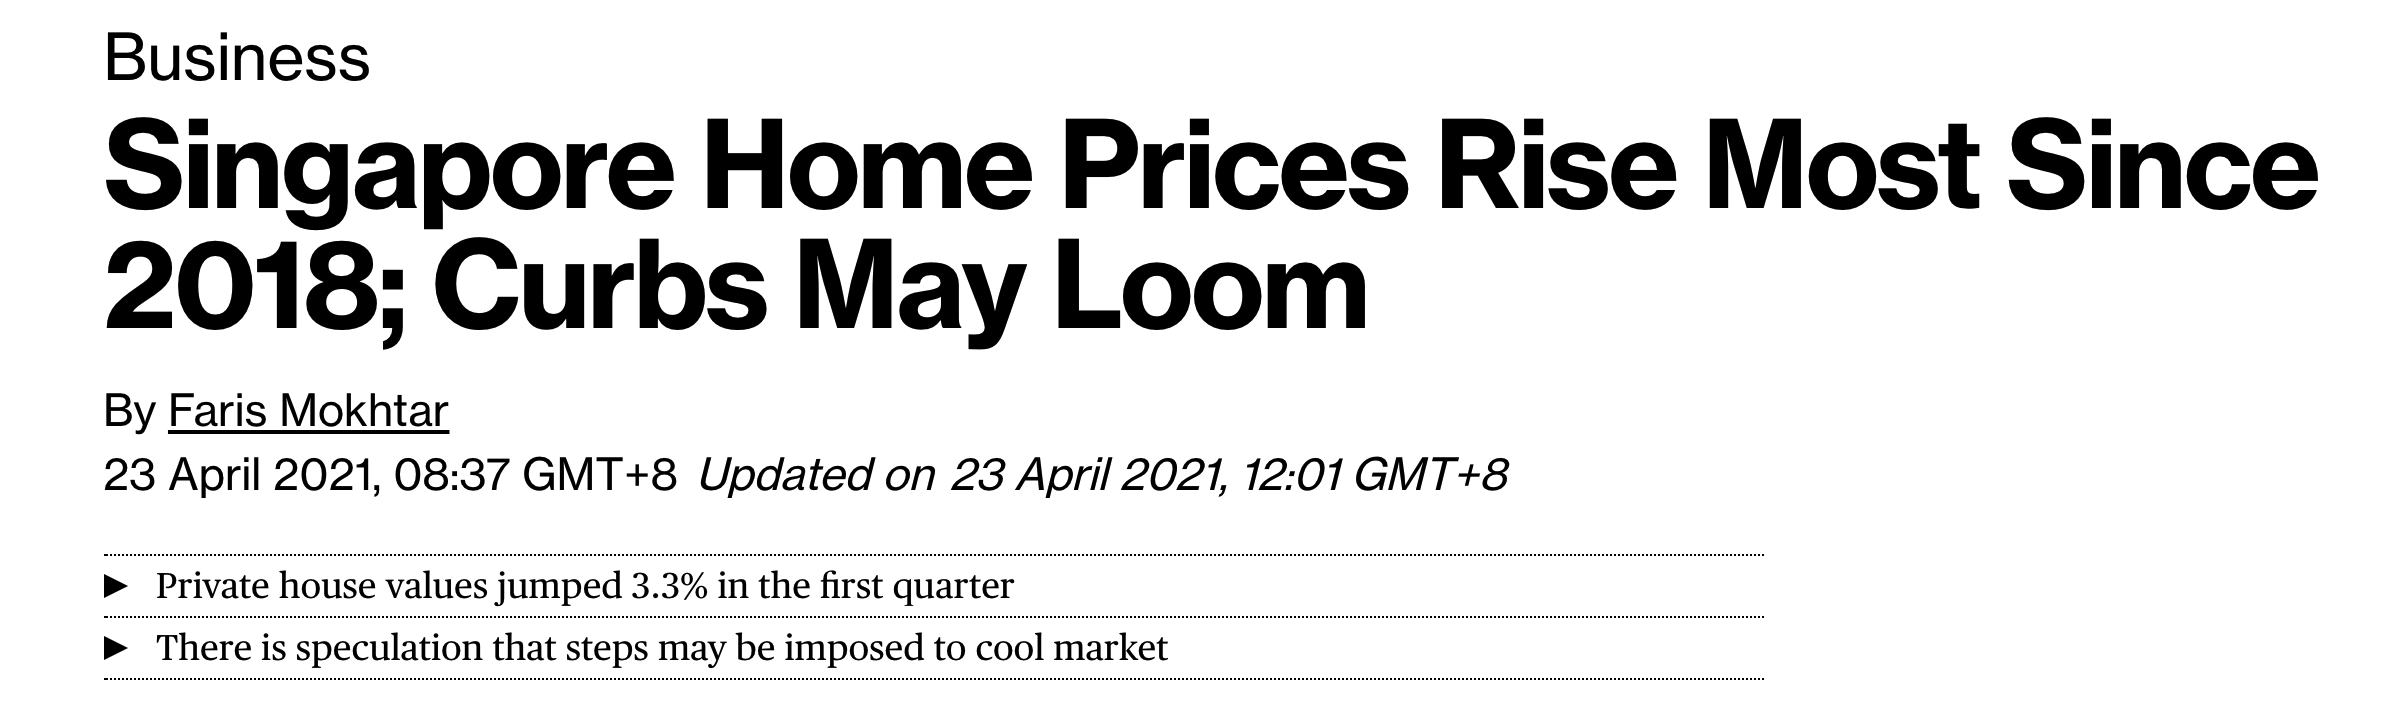
Image courtesy Bloomberg
The Explosive phase creeps in after the Mid-cycle dip, with the demand usually fueled by competitive interest rates amongst banks while the supply is the real estate market is not able to meet the rising demand. Typically, the last 2 years of the Explosion phase is known as the “winner’s curse”. No one has the definite answer to when the next recession will hit, or when will be the peak to the market, hence it wouldn’t be the most ideal if an investor enters the market during “winner’s curse” period of time and investors who enter and does not have a strong holding power will tend to lose out more.
Lastly, the Recession phase comes into the picture after a market crash. Typically lasting around three to four years, this is when the prices of properties tend to fall, leading to investors withdrawing from the market.
Why we mentioned that studying the market will be ideal before trying to invest is firstly because of how other markets will affect the real estate market as well. With the Recession phase typically coming into the real estate market picture three to four years after a market crash, investors can look out and take note of this to time when they would like to enter the real estate market, or to cash out in time before the phase hits.
Of course, one interested in property investing should take heed that trends are just advisory tools that can help you, depending on the situation. We highly recommend you to reassess your portfolio, while getting expert advice from trustworthy property agents. If you are keen, do contact PropertyLimBrothers here for more.

Image courtesy The Business Times
Observing the market is important because investors wouldn’t want a scenario where they follow the hype and enter the market during the Explosion phase with the Recession phase that follows right after. It could mean that the investor has to hold onto the property and wait for the market to pick up again, which may take years. And those who have lesser holding power might have to sell off their property during the Recession phase, which has a high chance of making a loss instead. No one can predict exactly when the market will reach its peak or vice versa, but it doesn’t harm to at least observe a little to avoid entering the market untimely.
Investors can also plan their exit after observing the market. Especially with the Seller Stamp Duty (SSD) imposed by the Singapore Government, one’s investment journey would be much longer as compared to that in the stock market, for example. Investors who have an ideal timeframe to play in the real estate market can plan when would be a better time to enter rather than following the hype, so that they will be able to ensure that they are able to sustain their investment throughout the timeframe and when they exit the market, they would be able to maximise their profit.
Some Condos with good investment potential
You may now question, what would define as a good investment in the real estate market? Here are some projects that we feel are ideal for investments in this quarter.

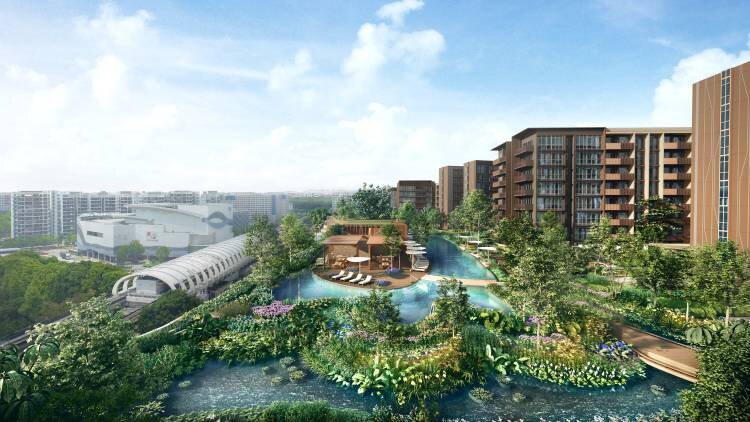
Pasir Ris 8 based in District 18, which caused a hype especially with the easties because of how the Pasir Ris has not had any new launch ever since the launch of Coco Palms in 2014. Located right beside the current Pasir Ris MRT and with the upcoming Pasir Ris MRT station on the new Cross-Island Line to be located in the basement of the mixed-use development, the connectivity to be provided by this project is splendid. With accessibility to the current Changi North Industrial Park, Changi Airport and the upcoming Aviation Park, this will appeal to expats working in the area, hence boosting the rental demand.
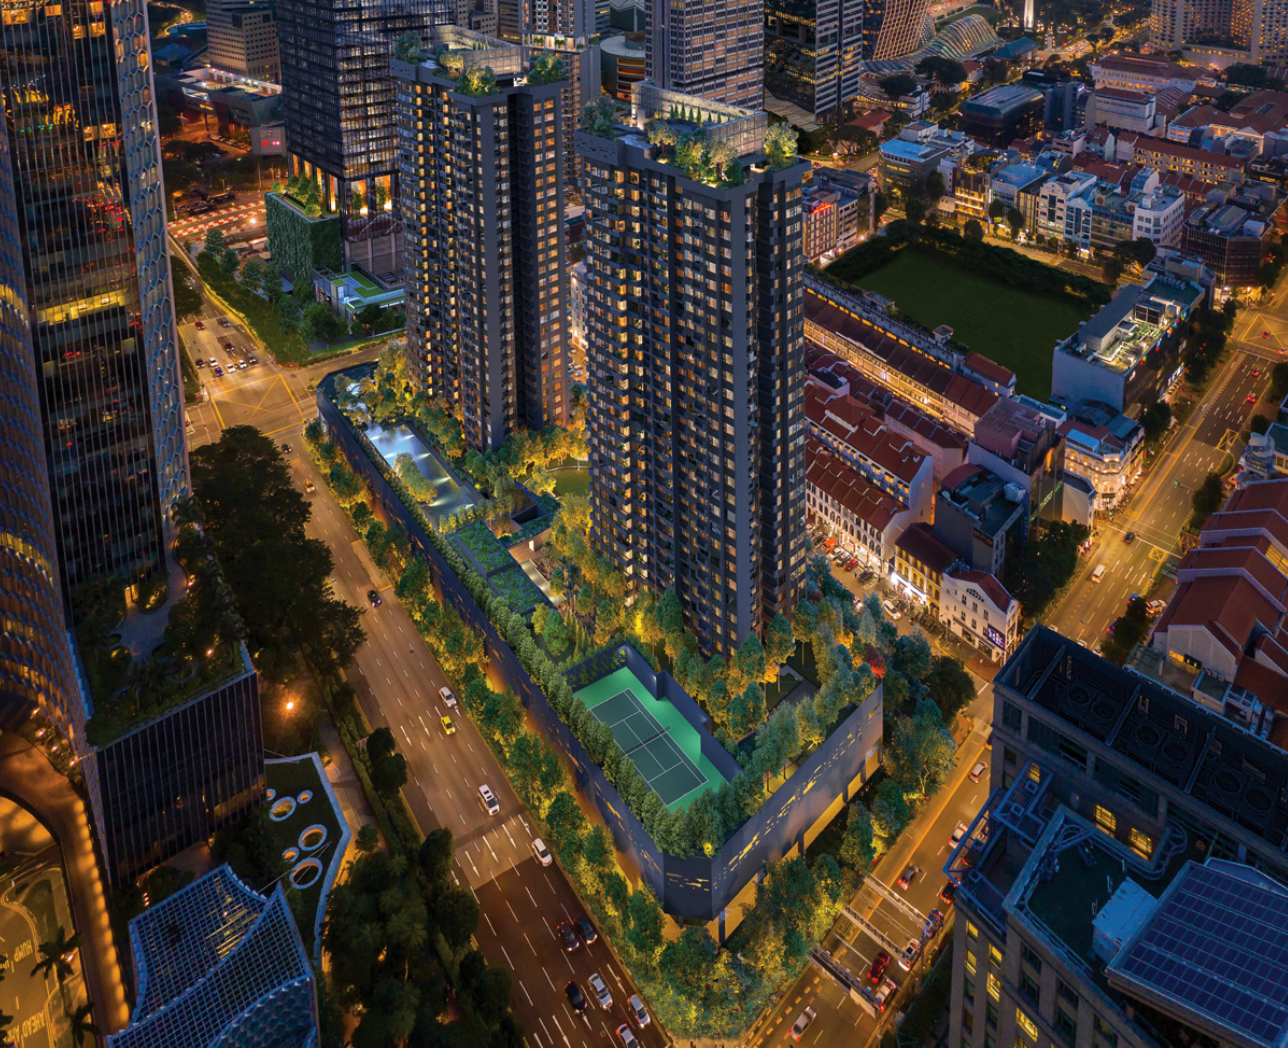
Another new launch coming very soon in September is Canninghill Pier nestled within District 06. Taking over what used to be Liang Court Development, this mixed-use development comes with a hotel which is a rarity, and is located right beside Fort Canning MRT on the Downtown Line. With its proximity to Clarke Quay, Robertson Quay, as well as the CBD area, the price of the properties in this project will be high not only because of the fact that it is within the CCR, but also because of its accessibility. Also, this proximity draws in rental demand from the expats working in the Grade A offices within CBD.

Midtown Modern is another interesting project worth investing in. Located in District 7, this mixed-use development is a five-minute walk to Bugis MRT, located on both the East-West Line and the Downtown Line. Its location also has direct access to amenities in the area such as Bugis Junction, Bugis Plus as well as other dining options in the vicinity. Also, with its location within the RCR, its accessibility and the CBD and other offices in the area, this project can be predicted to yield high rental demand and higher prices.
Some other interesting launches coming this year that you might be interested in as well:
-
The Watergardens (Preview on 17 July, launch on 31 July)
-
Parc Greenwich (Launch on 7 August)
-
Bartley Vue
-
Jalan Molek
-
Belgravia Ace
-
Perfect 10
-
Pollen Collection
-
The Commodore
Where should I buy then?
Prices have been heating up within the OCR and CCR. But with the current pandemic in place, causing a lot of fluctuations in the pricing of properties, there is a lot of uncertainty in Singapore’s real estate market. It would hence be wise to study your current investment profile to have a clearer picture on what are your options and their potentials before making a move to fully optimise your investment journey and make financially wise decisions.
At the end of the day, it is ultimately up to investors on what properties and in which areas they define as a good store of value. To add on, everyone’s investment journey is different, depending on factors like their lifestyles, their financial commitments, the jobs they are holding as well as others. With that, this article might not be that perfect fit for everyone’s investment plans, as what we might feel is a good or bad investment might not necessarily be the same for all. For a detailed and personal analysis, do feel free to contact us, we will be more than happy to assist you.