Here’s a balanced take on what’s really driving gains and losses in the Southern Islands planning area, also known as the Sentosa Cove, based on the realised address-level outcomes we computed and a look-back at the 2006–2010 cycle.
Who actually made or lost money
These are the address-level realised outcomes (first-to-last sale). They reveal where capital was preserved or multiplied — and where it wasn’t.
Top 20 addresses by realised percentage profit:
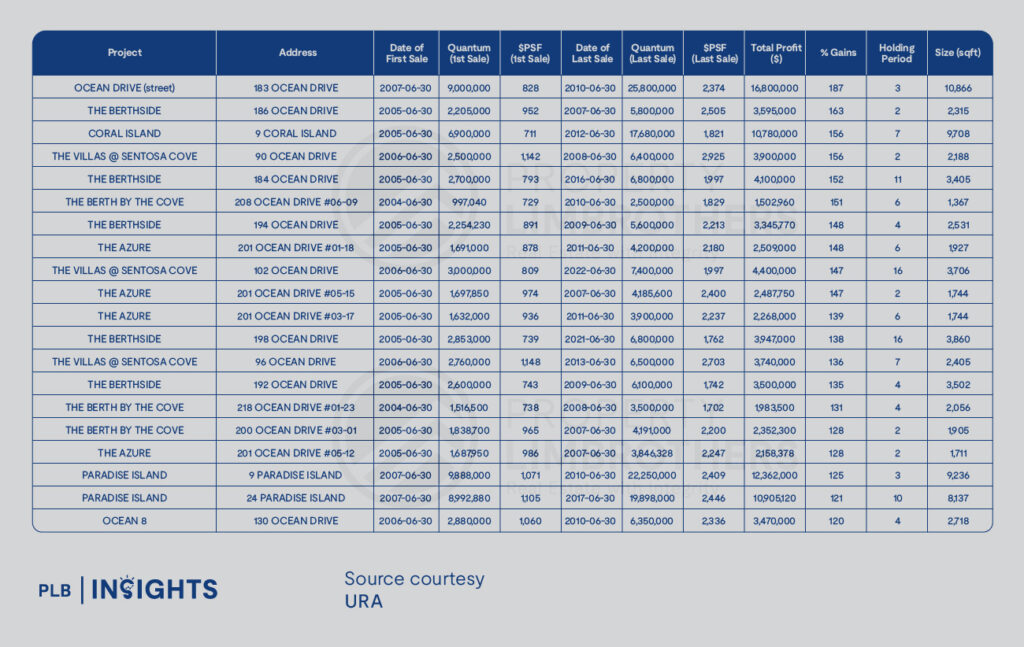
Note: Returns are based on first-to-last sale pairs only and exclude intermediate transfers between owners.
Percentage returns normalise by entry price; early-cycle acquisitions and lower entry PSFs dominate.
Bottom 30 addresses by realised percentage profit:
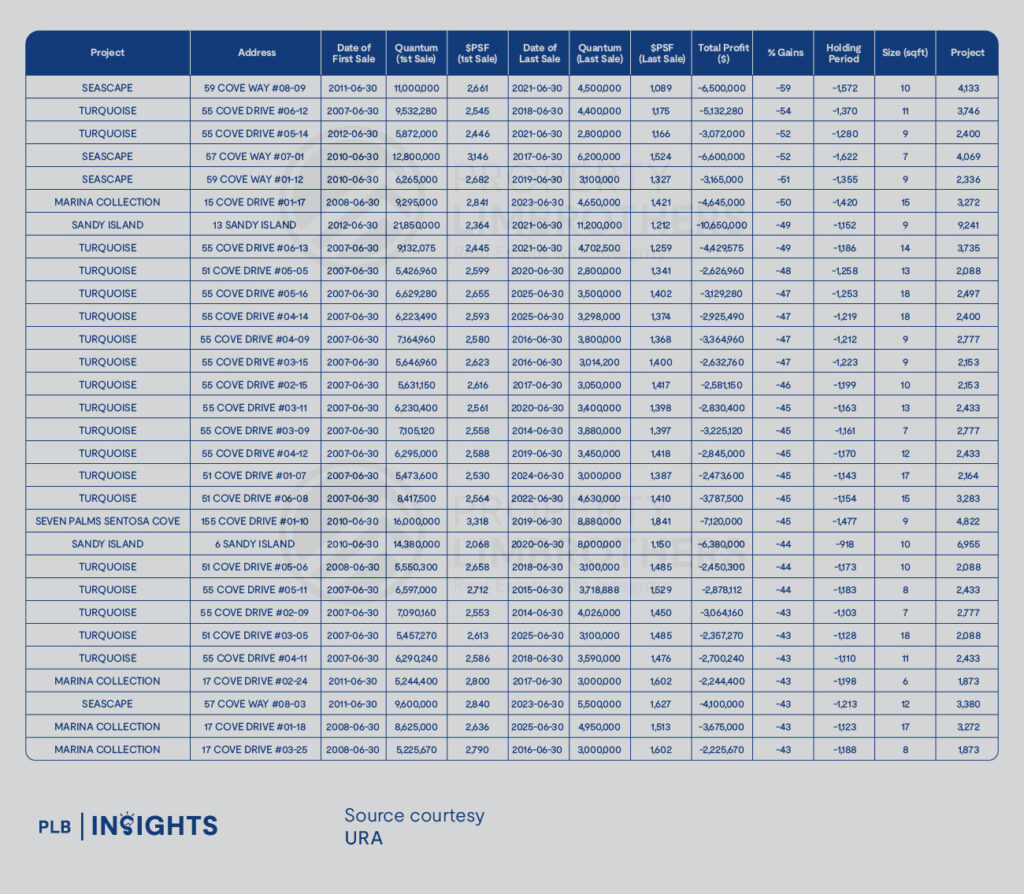
Note: Returns are based on first-to-last sale pairs only and exclude intermediate transfers between owners.
Losses concentrate where initial PSFs were at peak levels and holds stretched through weaker sentiment.
The pre-2010 surge: what happened and why it mattered
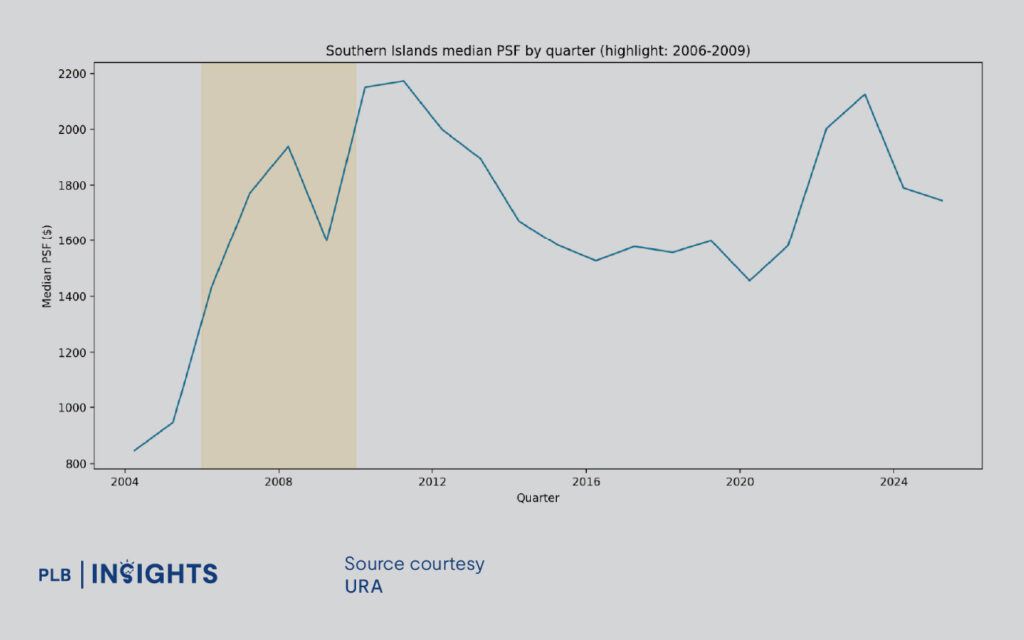
Prices and PSF didn’t just drift higher before 2010 — they jumped. You can see the sharp run-up in median PSF and transaction values across 2006–2009, followed by thinner volumes in 2008–2009 as the Global Financial Crisis (GFC) hit, and a subsequent rebound into 2010–2011.
The yellow highlighted areas indicate the GFC. From there, you can see a peak in prices post-GFC where the housing market experienced a recovery. Prices subsequently dropped significantly when the government introduced rounds of cooling measures.

Structural Drivers of the 2006–2008 Luxury Surge
Between 2006 and 2008, Singapore’s luxury property market was propelled by a combination of major catalysts and abundant global liquidity. The opening of large-scale attractions such as Resorts World Sentosa, together with the city’s expanding global profile, created a powerful expansion narrative that lifted sentiment across high-end segments. Easy credit conditions and strong risk appetite in the pre-GFC era directed significant capital into trophy assets, especially waterfront and branded residences.
At the same time, limited new supply allowed developers to launch projects at ambitious PSFs, often based on optimistic assumptions about buyer depth and sustainable demand. This period marked the height of speculative enthusiasm—where scarcity and aspiration drove valuations to new highs.
Policy Shifts and the End of the Easy Cycle
From 2009 onward, the policy environment began to change. Singapore introduced a series of cooling measures—starting with Seller’s Stamp Duty and later expanding to include Additional Buyer’s Stamp Duty and tighter LTV/TDSR regulations. These measures did not eliminate demand but fundamentally reshaped market behaviour.
The increased cost of leverage and speculation pressured resale values, especially in developments where entry PSFs were already high and buyer pools remained thin. Those who bought early benefitted from the upswing; those who entered late at peak valuations often faced a prolonged wait for prices to recover.
Appetite vs Liquidity: The Southern Islands Equation
In the Sentosa Cove areas, both appetite and liquidity matter—but liquidity ultimately decides outcomes. Market appetite sets the ceiling, while liquidity establishes the floor. During hot cycles, premium PSFs can clear easily as buyers compete for unique assets. However, when sentiment cools, the small pool of ultra-luxury buyers shrinks sharply, and clearing prices revert to where genuine demand lies.
The island proposition, while exclusive, inherently limits the addressable buyer base. This results in wider bid-ask spreads, longer marketing periods, and more pronounced price adjustments when sellers prioritise certainty over patience.
Why Some Projects Consistently Outperform
Certain developments demonstrate resilience through both good and slow cycles. Projects with early entry vintages from 2006–2010 benefit from lower land and launch PSFs, providing more room for realised gains later. Waterfront scarcity and superior micro-locations—those with true frontage, unblocked views, and privacy—continue to command premiums over mere proximity to water.
Design efficiency also plays a key role: units with practical layouts and balanced floor plates appeal to a broader buyer base, while financially strong owners help sustain prices by avoiding forced sales during weaker markets.
Why Others Struggle to Hold Value
Projects that underperform often share similar traits. Many were launched at peak-cycle PSFs that priced in perfection, leaving little upside once market conditions softened. High carrying costs—covering maintenance, taxes, and financing—compound pressure on sellers to accept discounts.
Additionally, when several near-identical projects or units compete for the same narrow buyer pool, buyers gain leverage. The least competitive units set the new market benchmark, pulling overall resale values down.
What the recent medians are hinting at
A quick look at quarterly medians gives a sense of how segments are faring:
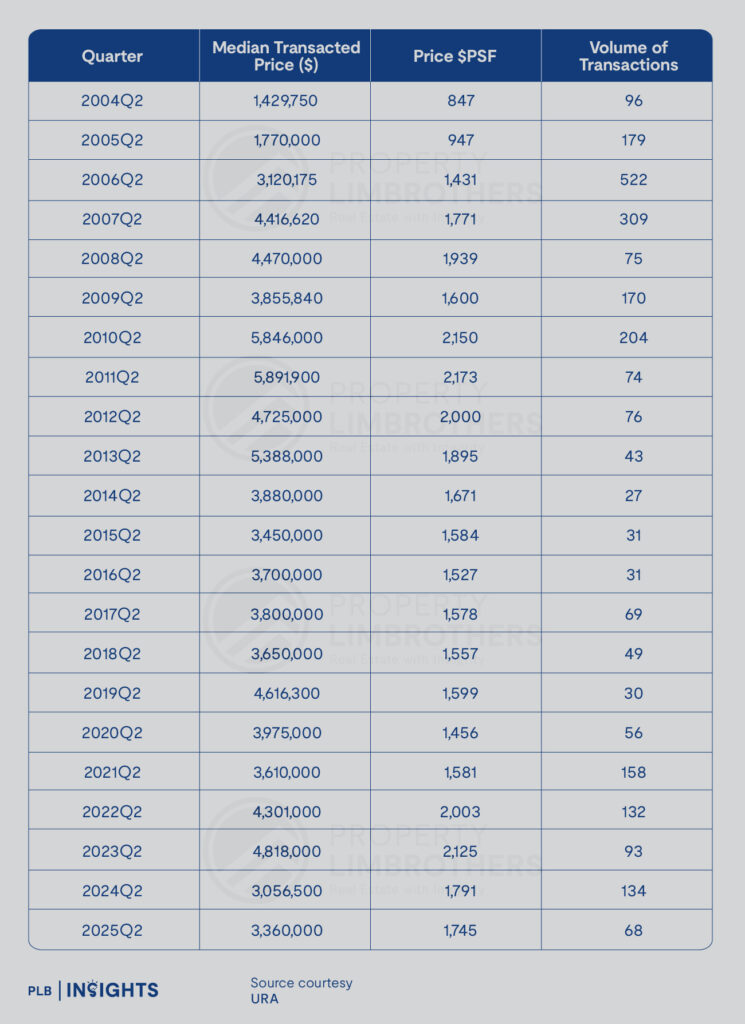
Overall quarterly medians:

These medians show:
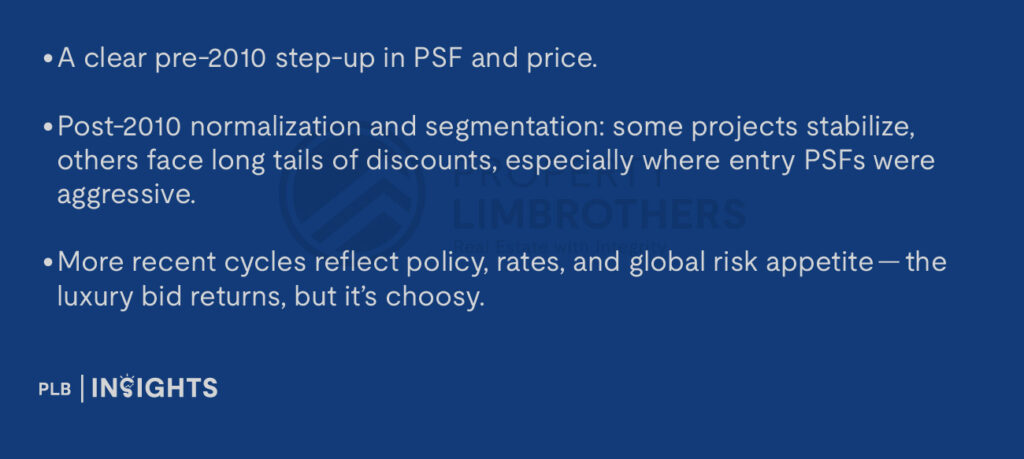
So is it appetite or volume?
It’s both — with an order of operations:
Stay Updated and Let’s Get In Touch
Should you have any questions, do not hesitate to reach out to us!