Executive Summary
As 2023 progresses, macroeconomic headwinds and geopolitical tensions are mounting, leading investors to adopt a cautious stance. The global market’s stagflationary conditions, characterised by high inflation and low growth, are significantly shaping investment behaviour and policy decisions. Governments and central banks remain vigilant, raising interest rates to manage inflation while balancing the risks of recession and ensuring financial system stability. In the wake of several bank runs in the US in 2023, investors are maintaining a state of heightened alertness, actively seeking out secure avenues to safeguard their wealth. The Singapore government’s intervention in the real estate industry carries significant implications for both investors and homeowners. Multiple waves of cooling measures have been introduced in late 2022 and 2023, alongside an increase in Government Land Sales (GLS) over the past few quarters. The government’s objective is to maintain price stability in the real estate market and prevent it from spiralling upwards under inflationary pressures and foreign buying interest. Housing affordability has emerged as a key concern, prompting policymakers to consider changes that may alleviate public anxiety on the matter. These policy shifts are likely to have far-reaching consequences for the industry as a whole. Residential properties in Singapore continue to climb higher this quarter as the stagflationary environment continues to drive up the prices of assets like real estate. Overall, while volume is lower than the earlier stages of the pandemic real estate boom, the transaction value of residential properties is on the rise for almost every residential segment. On the other hand, recessionary risks and macroeconomic headwinds have repressed the transaction value in commercial real estate. However, well-capitalised investors may be able to find opportunities to position themselves for the next bull market. The first quarter of 2023 has seen real estate prices continue to rise due to the impact of the stagflationary environment. As investors seek a hedge against inflation, many are turning to real estate as a viable option. While the recent introduction of tighter cooling measures and increased supply in the medium-term may lead to a tapering and stabilisation of prices in the coming years, inflationary pressures are likely to persist in the short-term, particularly in markets with medium-low transaction volumes.Foreword by Melvin Lim CEO, Co-founder PropertyLimBrothers (PLB)
As we look to the future of the real estate market in 2023, it is clear that investors and homeowners alike must stay vigilant and adapt to the changing market conditions. Despite the uncertainty and challenges, there are still opportunities to be found, and we remain cautiously optimistic about the direction of the market. With prices continuing to climb due to ongoing inflationary pressures and increased demand from both local and foreign investors. This has made it more difficult for local homeowners to decide what to do with their property in Singapore. At PropertyLimBrothers, we are committed to helping our clients navigate the real estate market with integrity and professionalism. We understand that the real estate market can be daunting and unpredictable, but with our extensive experience, data-driven insights, and creative marketing strategies, we are confident in our ability to add value to our clients’ property journeys.As always, our mission is to provide the best-in-class service and education to our fans, followers, and clients. With the current macroeconomic headwinds and geopolitical tensions, we understand the importance of staying informed and up-to-date with the latest developments in the finance and real estate sectors. This report will provide you with valuable insights into the state of Singapore’s real estate market in Q1 2023. From government interventions to the impact of stagflation, our team of experts has analysed the data and provided actionable recommendations for investors and homeowners alike. Our hope is that this report will serve as a valuable resource for our clients, helping them make informed decisions about their real estate investments and providing them with the knowledge they need to thrive confidently in 2023 and beyond. Thank you for choosing PropertyLimBrothers as your trusted real estate partner. We look forward to continuing to serve you and guiding you through the ever-evolving landscape of the Singapore real estate market.When it comes to property, risk is at its highest point when the property you invested in does not appreciate.
Methodology
The information presented in this report is primarily sourced from URA data, but we also incorporate data from other sources such as Squarefoot, Edgeprop, S&P Global, TradingEconomics, and Statista to complement it. In addition, we use data from reputable banks and consulting firms’ corporate reports as well as economic data from various government websites in Singapore, the United States, and other countries, including data from Central Banks worldwide. Our report focuses on significant global macroeconomic trends and examines how they could impact Singapore’s real estate market, taking into account changes in monetary policy and growth projections. We carefully consider both demand and supply factors in Singapore’s property market and use a combination of macro and micro conditions to provide an in-depth analysis. Based on our assessment, we offer our perspective on the likely performance of the real estate market in the upcoming quarters. The micro analysis primarily focuses on examining price and volume movements within the real estate market. To identify any disparities in the performance of various market segments, we utilise a non-parametric subsampling method. We obtain performance data from URA and then create sub-samples for analysis, which are divided based on factors such as property type, size, location, and other characteristics. The approach we use is mainly descriptive in nature, but we also incorporate some qualitative analysis and comments on consumer sentiment and behaviour. This Q1 report builds on the previous reports, which highlighted how the persistent macroeconomic challenges, including high inflation and interest rates accompanied by low growth, would continue to have an impact on Singapore’s real estate market in 2023.Contents
Macro- Stagflationary Environment driving Investment Behaviour
- Government Intervention in Real Estate
- Finding Market Direction after Macro Shifts
- Macro Watchlist for Market Participants
- Quarterly Growth in Residential Real Estate Segments
- Quarterly Growth in Commercial Real Estate Segments
- Relative Supply Trends & Money Flow Analysis
- In Focus — Opportunity Spaces for 2023Q2 and Beyond

Stagflationary Environment driving Investment Behaviour
Stagflation is one of the tougher economic problems to solve from a policy perspective. A combination of high levels of inflation along with low levels of economic growth have taken a long time to remedy in the past. To control prices (and wages) from spiralling upwards, central banks have relied on increasing interest rates as the primary tool used to control inflation. The world has started to see waves of retrenchment in some firms and more sustainable levels of wages in the technology sector. However, inflation measures remain persistently high, albeit increasing at a slower rate than previous quarters. The US Fed has started the disinflationary process to some degree. This process of bringing the price of goods and services down to a more sustainable level will take time. The Core Personal Consumption Expenditures (PCE) is the Fed’s preferred measure of inflation and is still on a steady increase. The latest reading on 28 April shows a 4.6% year-on-year increase. As planned, the Fed recently made another interest rate hike on 3 May 2023 of 25 basis points, the Fed Funds Rate has reached the target range of 5.00% – 5.25%.
The Fed has also signalled a pause in interest rate hikes should the disinflationary process continue until inflation levels hit their target of 2%. More interest rate hikes are still possible if inflation comes in above expectations. This process might take over a year barring any major shifts in the macro environment. Subsequently, interest rates may gradually be lowered as shown in the Fed Interest Rate Dot Plot below.
The US Fed has started the disinflationary process to some degree. This process of bringing the price of goods and services down to a more sustainable level will take time. The Core Personal Consumption Expenditures (PCE) is the Fed’s preferred measure of inflation and is still on a steady increase. The latest reading on 28 April shows a 4.6% year-on-year increase. As planned, the Fed recently made another interest rate hike on 3 May 2023 of 25 basis points, the Fed Funds Rate has reached the target range of 5.00% – 5.25%.
The Fed has also signalled a pause in interest rate hikes should the disinflationary process continue until inflation levels hit their target of 2%. More interest rate hikes are still possible if inflation comes in above expectations. This process might take over a year barring any major shifts in the macro environment. Subsequently, interest rates may gradually be lowered as shown in the Fed Interest Rate Dot Plot below.
 Singapore’s GDP growth estimates for 2023 has been recently downgraded. The seasonally adjusted quarter-on-quarter GDP for 2023 Q1 shows a contraction of -0.7%, which puts Singapore in the risk of a technical recession if 2023 Q2 prints a negative growth number. This translates to slower-than-expected growth, while inflation remains high. On the other hand, the MAS policy statement from mid-April expects 2023 as a whole to maintain a high CPI – All Items inflation of around 5.5% to 6.5%. The combination of low economic growth and high inflation poses a problem to investors looking for decent returns in a challenging market.
 The stagflationary environment has stunted returns from various asset classes. Equities and Bonds face challenges from high interest rates and low growth environments. While commodities such as Gold, and other physical assets like Real Estate (under specific conditions) may perform better. Both Value and Growth stocks in the S&P 500 index show stunted returns, along with the aggregate bonds index (AGG). The inflationary environment also weakens holders of cash. Singapore’s real estate market, however, was able to hedge against this stagflationary environment comparatively well with lesser downside volatility so far.

 The recently released URA Q4 data brings to light the continuing trend of rising prices and rentals in the private property market, indicating a larger trend of inflation. The Price Index for private residential properties has shown a significant increase of 3.3%, which is higher than the previous increase of 0.4% in 2022Q4. Similarly, the Rental Index for private residential properties has increased by 7.2%, which is only slightly lower than the previous quarter’s increase of 7.4%. These figures indicate that the real estate market continues to be impacted by inflationary pressures, making it important for investors and homeowners to keep a close watch on market trends.
 While the take-up rate (-68.4%) was depressed in the previous quarter, 2023 showed renewed interest with a 82.0% increase in take-up rate. The strong rebound in take-up rate was accompanied by a decrease in pipeline supply (-2.6%) and increased vacancy rates (0.5%). These are signs demand-pull inflation is very much present in Singapore’s real estate market, and more cooling measures could come into play if it rises to an unsustainable level.
 The stagflationary environment is bound to put further upward pressure on real estate prices in Singapore. As investors look to Singaporean real estate as a hedge against the current macroeconomic headwinds. Increased local and foreign interest in Singaporean real estate might also lead to additional government intervention in the industry. As with the recent ABSD changes and cooling measures regarding the medium-term interest rates, market participants should expect future changes should prices continue to move up.
Government Intervention in Real Estate
In this 2023 Q1 report, we discuss government intervention in two broad ways. First, the government can directly intervene by increasing or decreasing supply of land, which will be developed in a few years. This is a direct way of influencing the supply of residential or commercial units albeit with a development time lag. Second, the government can intervene by introducing cooling measures that can affect demand and supply side mechanisms in the real estate market. The effects are more immediately-felt as it affects the decisions of market participants. In the previous section, we have covered how a stagflationary environment might drive investors and attract capital to the real estate market in Singapore. Due to this demand-pull effect on the limited number of residential and commercial units in Singapore, prices may have been pushed up by both local and international demand. In order to maintain price stability and sustainable growth, such bullish action in the real estate market could attract government intervention in the form of added supply and cooling measures. Recent parliamentary debates on the issue of housing affordability might also spark a wave of policy changes, focused around increasing the supply of Build to Order (BTO) HDB flats and potentially extending the Prime Location Housing (PLH) model to a tiered system where flats in the future could have varying MOP periods and subsidy clawbacks. This could have drastic effects on wealth accumulation for future buyers of BTO and maybe even resale HDB flats. Such policies will further differentiate public from private properties and segment the market further.
 Despite the recent cooling measures implemented in September 2022, February 2023, and April 2023, residential property prices continue to rise further. Landed properties have risen sharply while private non-landed and resale HDB prices had modest gains. Market conditions seem to retain its bullish outlook despite consecutive cooling measures aimed at disinflating property prices. With public sentiment being very sensitive to the topic of housing affordability, future cooling measures may be geared towards ABSD, SSD, and potentially more stringent LTV limits for owners of multiple properties.
 Market participants need to remember that government intervention in the real estate space in Singapore is focused on price stability and sustainable price growth. Future interventions are likely to operate along this line. That being said, the government has likely learned its lesson from the previous oversupply situation from 2014. Coupled with the introduction of cooling measures back then, real estate prices were repressed for approximately 4 years. While such a scenario is unlikely to repeat itself, we should be reminded that the supply situation takes many years to pan out due to development cycles. As the pandemic-affected projects are mostly going to complete in the 2023/24 period, the market may experience slight relief from the fast-pace of price increases.
Finding Market Direction after Macro Shifts
The first quarter of 2023 has been marked by an increase in uncertainties and unexpected events, causing concerns among investors. The stability of the financial system has been questioned due to multiple bank failures in the US, and geopolitical tensions around the world have intensified, leading many to believe that we have entered a more volatile period. The global economy is experiencing major shifts in monetary policy, with governments increasingly prioritising their domestic markets, making it difficult to determine a clear direction amid the turbulence. Despite these challenges, it is important for investors to stay vigilant and informed, and to seek expert guidance to navigate through these complex and rapidly evolving market conditions. In particular, market direction in Singapore’s real estate market is far from clear. On one hand, stagflation favours price increase in real estate. Among other asset classes, real estate acts as a good hedge against the current macroeconomic headwinds. Especially so in Singapore, where scarcity and high demand create a stable growth environment without the downward volatility compared to other real estate markets in the world. However, added cooling measures and increasing supply in the real estate market could possibly dampen the prospects of price appreciating beyond a sustainable level. Together, these two factors make it difficult to determine the short-term direction of the real estate market at the aggregate level. To gain more insight into how the market responds to these macroeconomic conditions, we break down how each market segment has reacted over the first quarter of 2023 in the micro segment. The macro factors discussed have varying impacts on different segments of the residential and commercial real estate market. Aggregate changes might be less meaningful to market participants who have very clear interest in specific segments of the market. To make informed decisions in the current real estate market, it is crucial for investors and homeowners to be vigilant and monitor not just the aggregate market indices, but also the specific segment they are interested in. The impacts of macro shifts discussed earlier might vary across different segments of the residential and commercial real estate market, and therefore, one cannot make assumptions based solely on aggregate changes. This is particularly important for those considering specific property types such as landed properties or first private property purchases. By keeping a close eye on the micro segment, investors and homeowners can make informed decisions that are tailored to their specific needs and interests. At present, the market direction points to continued short-term increases in price and potentially higher transaction volume in the coming quarters as Singapore bounces back from the revenge travelling period of end 2022Q4 to 2023Q1. The effects of government intervention will take time to play out in the market. We expect the real estate industry to have continued bullish momentum, particularly in segments benefiting from disparity gaps in the market. In the medium term, recession risks, rapid interest rate cuts, and added cooling measures might potentially disrupt the current trend.Macro Watchlist for Market Participants
In order for market participants to stay ahead of the curve when it comes to making informed decisions, it is important to have a clear understanding and watchlist of potential macroeconomic shifts in the market that could change the current price trends in the real estate market of Singapore. In this section, we highlight important changes and shifts that might occur in the coming quarters or years. While impossible to predict, we provide a watchlist of important factors to keep in mind. We cover these macro factors regularly in our editorial pieces on our website as well as our NOTG channel on YouTube. You may follow these sources for the latest content on these issues. The first on the macro watchlist is inflation. In particular, we refer to US Core PCE Inflation and Singapore CPI – All Items. These two measures of inflation will provide a leading indicator to policy decisions on interest rates which subsequently affect mortgage rates and buying demand for property. The current target for inflation is 2% for most economies. Reaching this target rate or getting close to the target rate might be a signal for a dovish Fed pivot and interest rate cuts. The second on the macro watchlist is investor sentiment. This is an important measure of the appetite for spending – be it goods and services, properties, or investments, the market sentiment is in some way a short-term indicator of demand. Specific measures include the S&P 500 index and the VIX volatility index. Both of which could tell a clear picture of how spooked markets are. While the pandemic period launched Singaporean real estate into a bullish trend, we observe that past recessions (dot.com bubble and global financial crisis) and rapid interest rate cuts were associated with bearish real estate sentiment in Singapore. The third on the macro watchlist is the Singapore government’s intervention. Particularly the GLS trend and cooling measures that target mass market buyers. A combination of high GLS and mass market cooling measures resulted in 4 years of repressed property prices from 2014 to 2018. While there was only this major historical example, it is a way for regulators to initiate a “hard reset” to property prices should there be the need to do so. However, this could have far reaching impacts on housing inventory levels and the business of developers. This macro watchlist is not exhaustive. There are many other important macro factors that contribute to the price trend in Singapore’s real estate market. However, these three factors will be important in the short to medium term. As the current market is in a cautious state due to uncertainties at the macro level. Market participants and investors who are looking to make a decision soon in the property market should be well aware of how these factors might affect their plans, and should have strategies that minimise the risk of suffering losses from potential macro shifts in the near future.Quarterly Growth in Residential Real Estate Segments
To complement our macro analysis and outlook for the market in the coming quarters, we take a fine-grained approach in examining each market segment in residential and commercial real estate. The money flow analysis looks at the quarter-to-quarter movement of capital via transaction value across the different segments of the market. We further break down the property types by lease and district for a detailed fine-grained analysis of how the real estate market is performing. In this section, we examine residential real estate segments. This refers to resale HDBs, ECs, Condominiums, Apartments, and Landed properties including terraces, semi-detached, and detached homes. The percentage values refer to the quarter-on-quarter change in average PSF, the colour gradient of the boxes is based on this change in price. The size of the boxes refers to the relative transaction value to other segments, this tells us how large each market segment is and how much capital is moving into or out of each segment. Do note that the comparison values for the percentage change in PSF are based on within-subgroup. For example, Leasehold Condominium in District 9 will be compared to the previous quarter’s average PSF in Leasehold Condominium in District 9 and not the average of the entire Condominium group. If there are no transactions for that subgroup in 2022 Q4, the percentage change in PSF will be blank but there will still be a reported volume and PSF values of the current quarter. If there are no transactions in 2023 Q1 then there will be no subgroup box present and no values will be reported at all.
Resale HDB & Executive Condominium
For the Resale HDB subgroup, we see prices rising steadily, with the exception of Choa Chu Kang, Sembawang, Woodlands, Pasir Ris, and Jurong West in the OCR areas. Kallang-Whampoa, Geylang, Central Area, Marine Parade, Bukit Timah are areas nearer to the city area that experienced a slight decline in prices. Even though these subgroups did not grow in price, the decline is moderate and can be considered as a short-term correction in prices. The declines ranged from -0.2% to -2.4%. However, 16 out of 26 planning areas (approximately 61%) experienced price growth. With quarterly growth ranging from 0.4% to 9.8%, the upside has much larger variance than the downside for the resale HDB segment. Government intervention aimed at affordable public housing may target to reduce this upward volatility in prices through the potential increase in supply. The top growth area is Bukit Batok, with a quarterly growth rate of 9.8% and a total of 298 transactions. The planning area with the most severe price correction is Kallang-Whampoa, with a quarterly growth rate of -2.4% and a total of 205 transactions. Do note that remaining lease of the transacted flats may be a key reason for the price decline in certain planning areas.
The planning areas with the highest transacted value is Punggol, followed by Woodlands, Tampines, and then Sengkang. These heartlands appear to have the most active resale HDB market, signalling potentially better liquidity and demand for resale HDB assets in these planning areas. HDB Upgraders might most likely be coming from these planning areas with high transaction value as well.
However, 16 out of 26 planning areas (approximately 61%) experienced price growth. With quarterly growth ranging from 0.4% to 9.8%, the upside has much larger variance than the downside for the resale HDB segment. Government intervention aimed at affordable public housing may target to reduce this upward volatility in prices through the potential increase in supply. The top growth area is Bukit Batok, with a quarterly growth rate of 9.8% and a total of 298 transactions. The planning area with the most severe price correction is Kallang-Whampoa, with a quarterly growth rate of -2.4% and a total of 205 transactions. Do note that remaining lease of the transacted flats may be a key reason for the price decline in certain planning areas.
The planning areas with the highest transacted value is Punggol, followed by Woodlands, Tampines, and then Sengkang. These heartlands appear to have the most active resale HDB market, signalling potentially better liquidity and demand for resale HDB assets in these planning areas. HDB Upgraders might most likely be coming from these planning areas with high transaction value as well.
 In the Executive Condominium (EC) subgroup, the quarterly growth numbers predominantly point to a high upside. The quarterly growth ranges from -0.1% to 10.4%. The range is mostly on the positive side. While District 18 (Tampines, Pasir Ris) is the largest part of the EC subgroup by transaction volume, it also has the lowest growth number. This might be due to competition with other condominiums and resale HDB options in the same district. On the other hand, District 23 (Hillview, Dairy Farm, Bukit Panjang, Choa Chu Kang), 24 (Lim Chu Kang, Tengah), and 20 (Bishan, Ang Mo Kio) have better quarterly growth at 10.4%, 7.2%, and 6.5% respectively. Even though these districts have a smaller transaction value, those units that are transacted profited handsomely.
Leasehold Condominium & Apartment
In the private non-landed property segment, we look at leasehold and freehold categories separately. We also differentiate between condominiums and apartments in this analysis to identify if there is any tangible difference. Leasehold condominiums had a larger range for quarterly growth, from -10.9% (District 21) to 56.7% (District 23). Leasehold apartments had quarterly growth that ranged from -5.5% (District 15) to 35% (District 16). The transaction volume is much higher for leasehold condominiums than for leasehold apartments. The variance in performance between districts also point to the importance of choice when it comes to investment performance in private real estate segments. We do not cover the specifics of project-level analysis and which projects contribute to the quarterly growth in this report. For more specific information that you need for your property journey, you may contact us here.
 While some districts experienced a decline in average PSF, it might not be an indicator that the districts are undesirable. Rather it may be a temporary correction in price after a steep upward trend, or that a different composition of projects were transacted in the quarter compared to the previous quarter (especially with low transaction volume). On some occasions, districts which have their price corrected due to price disparity with other districts may provide good entry opportunities with deeper analysis. District 2 (Anson, Tanjong Pagar), 15 (Katong, Joo Chiat, Amber Road), 20 (Bishan, Ang Mo Kio), 26 (Upper Thomson, Springleaf), may interest buyers but further analysis is required to see if the fundamentals of the specific projects are sufficient to support further price appreciation.
Freehold Condominium & Apartment
Freehold options for Condominiums and Apartments exhibit a different price behaviour. Freehold apartments now have a larger range in quarterly growth, from -11.3% to 73.1%. This is much larger than the leasehold condominium performance range. Freehold condominiums have a range of -16.7% to 23.9%. This information suggests that freehold options in the condominium and apartment segment seem to face more downward volatility compared to their leasehold counterparts. While the freehold status frees owners from the concern of lease decay and its effect on price, it would seem that homeowners need to ensure that they still make sure that the property they purchase have strong fundamentals that support further appreciation in price. The freehold status is not a sufficient or necessary indicator of strong investment performance. The premium buyers pay for freehold properties might also not be realised until a much later stage in the properties’ lives.
 For freehold condominiums, Districts 1, 4, 14 seem to have the best performance in quarterly growth despite their relatively smaller transaction value. For freehold apartments, District 5, 16, 17 have put out stronger quarterly growth. District 5 in particular has decent transaction value to make it stand out and is worthy of further consideration for homeowners and investors who currently own a freehold apartment in this district.
There are quite a few districts that faced a price correction of greater than 5% compared to the previous quarter. In particular, districts 3, 13, 27, 28 might have discount opportunities for freehold condominiums. Likewise for freehold apartments, districts 3, 4, 8, 13 may present specific opportunities for buyers at the current market prices.
For freehold condominiums, Districts 1, 4, 14 seem to have the best performance in quarterly growth despite their relatively smaller transaction value. For freehold apartments, District 5, 16, 17 have put out stronger quarterly growth. District 5 in particular has decent transaction value to make it stand out and is worthy of further consideration for homeowners and investors who currently own a freehold apartment in this district.
There are quite a few districts that faced a price correction of greater than 5% compared to the previous quarter. In particular, districts 3, 13, 27, 28 might have discount opportunities for freehold condominiums. Likewise for freehold apartments, districts 3, 4, 8, 13 may present specific opportunities for buyers at the current market prices.
Leasehold & Freehold Strata Landed
The strata landed category consists of Terrace, Semi-Detached, and Detached homes that have a strata title and are found in either a condominium or apartment complex. We highlight this niche subgroup of residential properties in this report as they might present key opportunities in the coming quarters. While the size of this segment is considerably smaller than the other types of properties we are covering in this report, it is natural to expect prices to range more and exhibit greater volatility due to the smaller sample size of transacted properties in each quarter. For the leasehold option, the quarterly growth ranges from -48.6% to 47.0%. Most districts exhibit positive growth. The top performing district for leasehold strata landed is District 19 with a 47% growth but only 1 transaction and with the least transaction value. Other units in the same district might be tempted to exit after such tremendous growth. District 11 also posts strong quarterly growth at 20.1% with the largest transaction value in this subgroup of leasehold strata landed. On the other hand, District 5 posts a major decline of -48.6% might be due to lease decay concerns. This district is worthy of deeper analysis for interested buyers.
 Interestingly, the freehold options for strata landed had more negative growth districts. The quarterly growth for this subgroup ranges from -30.6% to 377.2%. Most districts had a negative quarter. This presents a unique opportunity for interested buyers as the entire segment might be facing a price correction due to price disparity gaps between the landed and luxury condo & apartment segments. District 11 posted an anomalous growth rate of 377.2% which may be due to a very different project being transacted in the previous quarter. The transaction volume is only 1 for this anomalous case. Districts 5, 10, 14, 19, 28 may provide great entry opportunities for investors and buyers interested in this segment.
Leasehold Landed
The landed property segment is one that is being watched by market participants. Typically, this segment has eye-catching headlines and high profile owners that make great stories in the press. It also attracts aspiring landed home owners to stay on their toes for good opportunities for them to finally own a landed home. In this section of the report we will cover leasehold and freehold landed homes separately. We will cover Terrace, Semi-Detached, and Detached homes separately in the leasehold and freehold categories as well. Do note that there may be more price volatility in each subgroup as the price of landed properties also heavily involves the condition of the building and not just the location. Leasehold Terraces has a quarterly growth range of -20.5% to 19.6%. District 28 had the highest transaction value along with the highest quarterly growth of 19.6%. On the other hand, District 19 had the second highest transaction value with the second lowest growth of -19.2%. Terraces have a much higher transaction volume when compared to semi-detached and detached homes in both the leasehold and freehold categories.
 The leasehold semi-detached subgroup has a quarterly performance range of -75% to 70.6%. District 10 is the top performing district in this category with the largest transaction value and highest growth as well. Leasehold landed home owners in this district may be tempted to exit with such strong growth numbers. However, if the growth is driven by sales of newly developed landed properties, the existing pool of leasehold landed properties may not benefit as much. The sharp decline in District 23 and 16 are due to lease decay concerns. An important caveat in this part of the report is that transaction volume is much lower for the landed segments. As a result, the reliability of our inference and generalisability of the analysis may be limited.
 For leasehold detached homes, district 4 posted the highest growth with 5 transactions and the highest transaction value. It also posted a quarterly gain of 10.5%. Again the same caveats apply to this subgroup due to the lower volume of transactions as the nature of the landed segment.
Freehold Landed
Compared to the leasehold landed category, freehold landed homes account for approximately 75% of all landed homes. As a result, the growth numbers for this segment of freehold landed properties will be more reliable for inference and generalisation purposes. Even among freehold landed properties, quarterly growth can vary tremendously. The quarterly growth for freehold terraces ranges from -22.3% to 92.6%. District 9 has the highest growth but posts only 1 transaction for the quarter. Districts 19, 28, 11, 23, seem to post much more stable growth with more transaction volume. However, some districts faced a moderately high correction. In particular, districts 9 and 10 are worthy of attention and may provide potentially good entry prices for aspiring landed home owners.
 Freehold semi-detached homes faced mixed outcomes when it comes to growth. The quarterly growth for 2023 Q1 ranges from -33.1% to 52.4%. The mixed performance may be due to both the conditions of homes sold as well as the prevailing price trend for each location. Districts 10, 28, 21 seem to have more reliable growth in this quarter compared to the rest in the subgroup. On the other hand, District 15 and 19 appear to be discounted at current market prices in 2023 Q1.
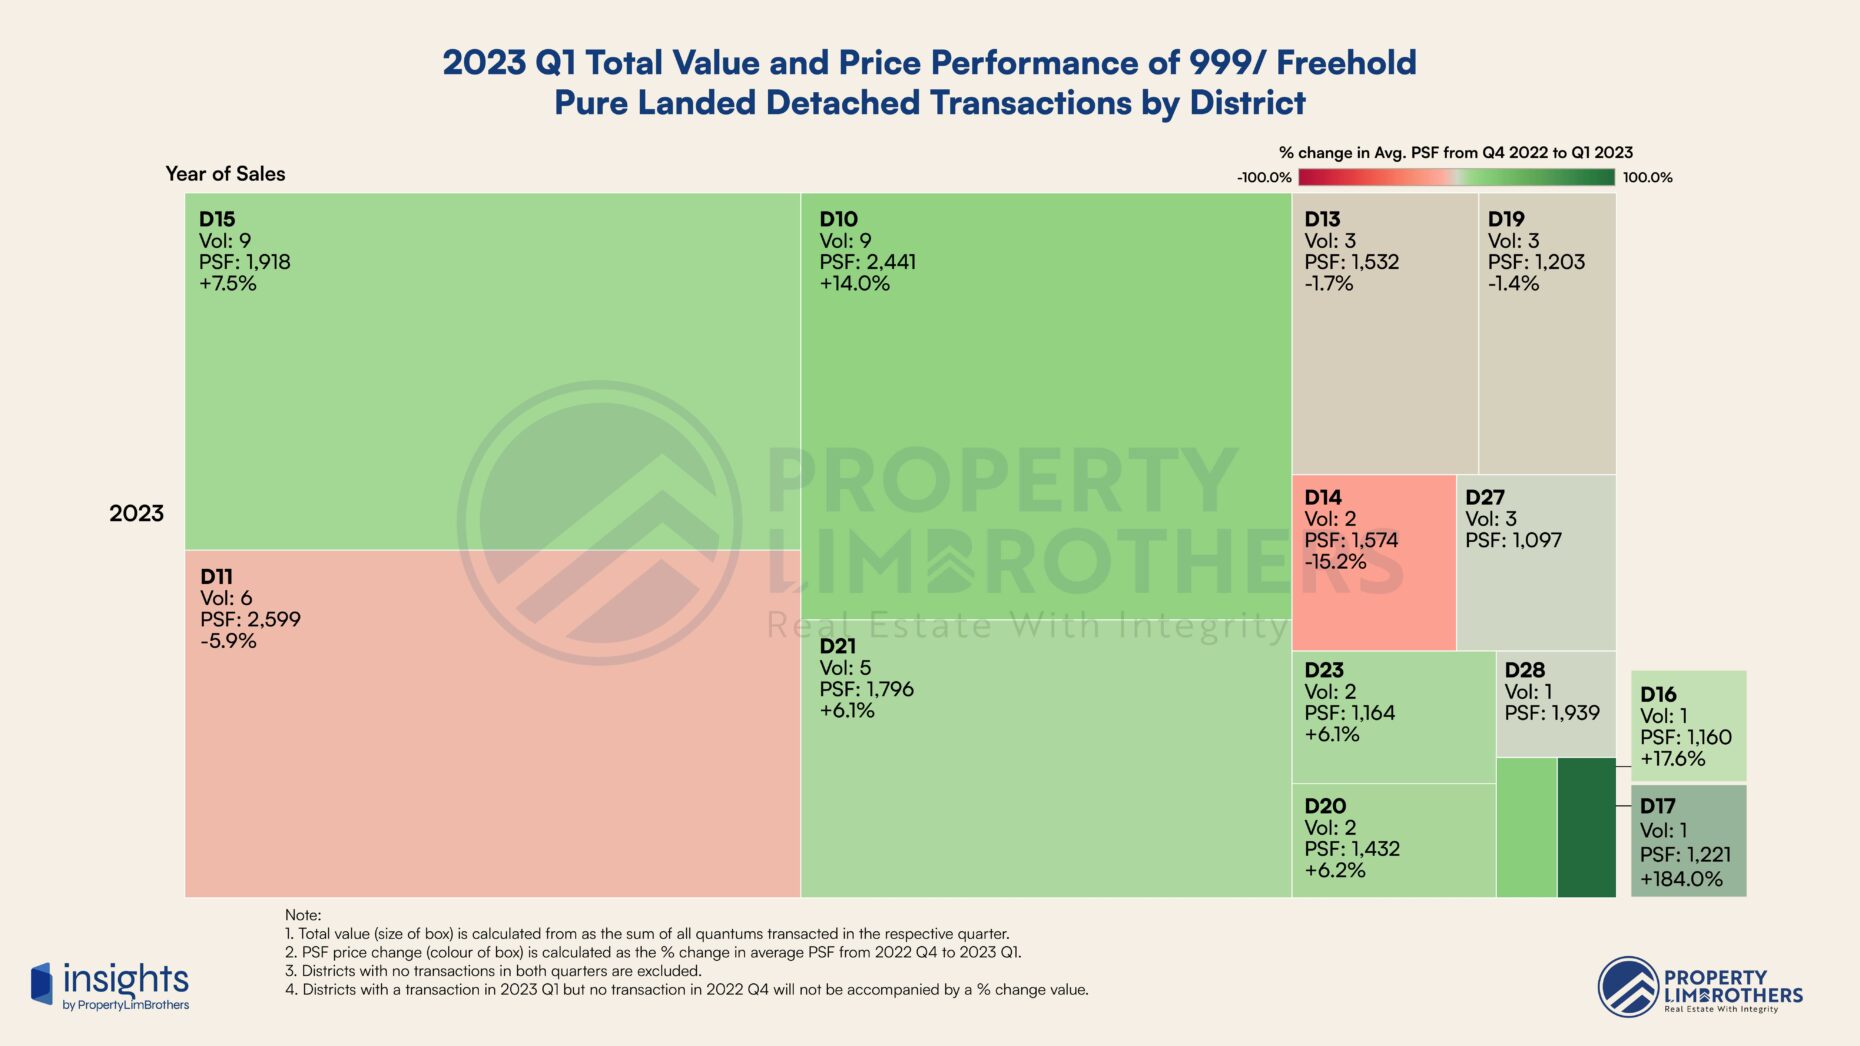 Finally, for freehold detached homes, we observe a quarterly growth range of -15.2% to 184.0%. As the most prestigious and coveted subgroup of residential properties, we see that the performance of these luxurious properties are considerably better compared to other landed properties. Districts 15, 10, and 21 are high transaction value districts that post stable gains this quarter across a decent number of transactions. On the other hand, District 11 is facing a slight correction with the second highest transaction value but a negative quarterly growth of -8.9%. Do note that this negative number is still within the expected range for differences based on the condition of the homes sold.
Quarterly Growth in Commercial Real Estate Segments
In this report, we cover the commercial real estate segments as there may be renewed investment interest among foreign investors due to the recent ABSD hikes on residential properties. As a result, it is important to see how the different commercial real estate segments perform over the previous quarter. Typically, Shop Houses are the best performing segment among commercial real estate from a historical perspective. In 2023 Q1, we see that the quarterly growth ranges from -36.4% to 54.3% with half of the districts posting negative growth. The key fundamental reason for historically strong performance in the Shop House segment is the limited supply, especially for conservation Shop Houses. We see District 8 post strong quarterly gains 40.2% with the highest transaction value for the subgroup this quarter. Districts 1, 2, 7, 15, 19 are undergoing a correction from the bullish momentum over the past 2 years from the pandemic boom.
 On the contrary, office and retail commercial space have suffered through the pandemic. While rentals and prices have started to recover with the global economic recovery, current macroeconomic conditions and recessionary risk continue to create hurdles for further upside. The recent ABSD hike, however, might attract foreigners to invest in the commercial real estate space rather than the residential option. Office commercial real estate had a quarterly growth range from -28.0% to 9.6%. District 7 was the top performing district by quarterly growth with moderate transaction value. District 1 posted decent quarterly growth of 5.1% with the highest transaction value. Districts 2, 6, 8, 9, 18 are currently experiencing a steep correction which may be worth some further investigation.
 Retail commercial real estate had a quarterly growth range from -47.9% to 58.0%. This is a wide range for commercial real estate but is also reflective of the differences in foot traffic and business among different districts. Districts 6, 14, 21, 22 posted very strong growth this quarter. On the other hand, districts 5 and 12 faced a severe correction in price. Do note that the differences in quarterly growth performance might also be influenced by the remaining lease of the properties being transacted in 2023 Q1. Especially so if the transaction volume is very low for the quarter.
Relative Supply Trends & Money Flow Analysis
In this section, we examine the relative supply trend for the private residential segment as well as the money flow between different property segments. By looking at the trend for transaction value, we are able to analyse the flow of capital across time and between property segments. We use this to infer how market sentiment and interest changes for different segments of Singapore’s real estate market. The inferences made from the pipeline supply assumes a development time of 4 years, we use it to roughly approximate how prices might respond to changes in the supply of new units in the private real estate segment. Looking at the past 5 years of pipeline supply for ECs, we notice an upward trend in the number of ECs under construction. This points to an increasing number of units to be supplied to the market in the coming years. Note that these units would have most likely been sold as new launches, and would need to pass the MOP before being sold on the resale market. With this time lag in addition to the higher new sale prices, the EC market may still have demand outstripping supply for the short-term.
 The pipeline supply for the private residential segment shows a gradual increase from 2018 to 2021, subsequently declining mildly to 2023 for under construction units. Planned developments remain high from 2022 to present. Overall, there seems to be a stable quarterly distribution of under construction and planned developments in the range of 40,000 to 50,000. This does not point to an oversupply risk at the moment. However, the increase in under construction developments from 2018 to 2021 may start to be completed as TOP projects in the coming quarters. Depending on the percentage of owners that decide to sell their home on the resale market, private properties may or may not have an influx of property listings in the coming months.
 Together, the EC and resale HDB segments achieved almost $4.5 Billion in transaction value in 2023 Q1. This declined from the previous quarter, which achieved around $5.75 Billion in transaction value in 2022 Q4. This is a moderately sharp decrease, mainly from the fall of EC transacted value. HDB transacted value actually increased over the past quarter at a modest pace.
 The quarterly transaction value for the private non-landed segment was positive. Transaction value of this segment rose beyond $8 billion in 2023 Q1, it posted an increase of more than $1 billion in transaction value. All components increased in transaction value, showing a recovery from the 2022 Q4 volume slump which may be attributed to revenge travelling and global reopening trends for tourists. This is not to say that transaction value will only increase from here. There are still macroeconomic headwinds and recessionary risks that might slow down the movement of capital in the private non-landed real estate segment.
 The landed property segment experienced a slightly better quarter compared to 2022 Q4. Transaction value in 2023 Q1 is just shy of achieving $2 billion in transaction value. Most subgroups posted a similar transaction value, with the only exception being detached homes posting a higher transaction value in 2023 Q1, contributing to most of the gains compared to the quarter before.
 The transacted value for commercial real estate has fallen tremendously from the recent peak in 2021 Q4. Since then, the transaction value has fallen from over $3 billion to slightly less than $0.5 billion on a quarterly basis. Current recessionary concerns may continue to repress prices in commercial real estate, but may be an opportunity for well-capitalised investors to find good opportunities to position themselves for the next bullish move in commercial real estate.