Executive Summary
Concerns of an upcoming recession are growing. Rising inflation and interest rates brings with it suspicion that the global economy is entering a period of stagflation. The United States will likely be one of the first countries to enter a recession ahead of Europe, and China. The Chinese economy is also experiencing a property crisis which can potentially bring about a housing-led recession. Despite the tough economic conditions, Singapore remains relatively stable and has ample time to prepare for an upcoming recession.
Amid a worrisome period of Quantitative Tightening and new Cooling Measures, Residential property and Rental indexes have continued to rise. The Commercial real estate segments are exhibiting a potential slowdown with Q2 data and Industrial real estate segments have made a marginal price recovery which leaves the likelihood of a broad-based recession still inconclusive. As different sectors of the Singapore economy struggle to grow in 2022, real estate remains one of the strongest contributors to positive GDP growth.
Reiterating our position from the Q1 report, 2022 still presents unfavourable macroeconomic conditions for investors. The prospect of a global recession is also on the table. Existing and prospective homeowners need to remain cautious and not to overextend their finances by taking loans larger than they can comfortably afford. Rising interest rates and an elevated risk of unemployment should be a warning sign for the buyer-side of Residential properties. In contrast, the current price levels remain favourably high for the seller-side for the time being. The gradually shrinking demand and transaction volume would most likely mean a longer and more difficult time to exit Residential properties in the coming months. We focus on Resale OCR Leasehold Non-Landed Properties as an opportunity space for the short-medium term.
Download the report here!
Foreword by Melvin Lim
CEO, Co-founder PropertyLimBrothers (PLB)
Fear is attempting to take a hold of Singapore. The crypto winter and bear market for stocks have spooked investors and made many lose confidence in achieving good returns for 2022. Despite the fear of a probable recession, PLB stands by our promise to act and think in the best interest of our clients and prospects, to temper their fears and to provide advice that acts as the light at the end of the tunnel. We believe in making decisions and planting seeds for the long-game. Imparting this perspective to our business partners and clients has been a priority for us.
“Behind Every Property is a Home, and Behind Every Home is a Family.”
A property purchase should not stretch a family’s finances to the point of stressing over reduced expenses to meet mortgage payments. Neither should it compromise the family’s comfort and personal needs simply to achieve investment returns. A home should be a place of safety and rest for every family. Recession or not, each family should be able find comfort and not stress in the property decisions that they have made. Knowing how crucial this decision is for our clients, we aim to provide a unique combination of empathy, foresight, and courage to deliver sensible solutions at the appropriate time.
We would like to thank all of our avid viewers and clients for their unwavering attention, support, and trust in the way that we do our work. We hope that our creative contents and reliable services continue to lift up and breathe life into our audience. We would also like to thank all of our business partners, media, tech, and research team for their hard work and contributions to bring PLB to where it is today. Thank you for being an important pillar of strength for PLB. We at PLB intend to continue to provide the best that we can for all of our stakeholders.
Methodology
This report is based on caveat lodged data provided by URA. We supplement this main source of data with other data providers, such as Squarefoot, Edgeprop, TradingEconomics and Statista. Other third party sources also include corporate reports published by reputable banks and top consulting firms. We also make use of economic data provided by various government websites from Singapore and the United States, including information from Central Banks around the world.
Our report pays attention to key macroeconomic trends in the world. We look at how changing monetary policy and growth outlooks might affect the real estate market in Singapore. Close attention is given to Singapore’s demand and supply factors in the property market. Using both macro and micro conditions to inform our analysis, we share with you our take on how the real estate market will perform in the coming quarters.
Micro analysis is mainly centred upon price and volume movements in the market. We use a non-parametric subsampling approach to find discrepancies between the performance of different segments in the real estate market. We take performance data from URA and proceed with creating subsamples for analysis. The samples are sliced by property type, size, location, and other characteristics. The mode of analysis is mainly descriptive. With some qualitative analysis and comments on consumer sentiment and behaviour.
The Q2 report pays special attention to the risk of Singapore entering a recession. We look at macro and micro risk factors that might potentially signal a downtown in markets. Data from the United States is mainly used for our analysis on this point. The report also serves to temper the fears of Singaporean consumers. Bringing to mind the light at the end of the tunnel, by focusing on the potential returns that could potentially be made in the recovery periods following recessions.
Contents
Macro
-
Inflation — The Story of 2022
-
Interest Rates as the Penicillin
-
The GDP Situation in the World Right Now
-
Potential Recession on the Table
-
Unexpectedly Low Unemployment for Worrisome Times
Micro
-
Singapore Housing Prices over Past Recessions
-
Geographical Distribution of Performance, Price, Supply
-
Supply of Housing & Potential Changes
-
Sustainability of Demand & Price Supports
-
In Focus — OCR Resale Non-Landed Leasehold Properties
Inflation — The Story of 2022
Inflation has been one of the biggest stories of the year. As an update from the previous report, inflation is still a pressing issue with no clear evidence of it peaking just yet. From an economic perspective, inflation is behind many of the stories on interest rates, company earnings, gross domestic product (GDP), and more. It is an important economic indicator to monitor the health of the economy.
For people without a background in economics, Inflation is like bacteria in your stomach. You need it to help you digest food. It’s an integral part of the system and the process. However, if you have too much of it, you will fall sick. Gut bacteria to your stomach is what inflation is to the economy. Moderate amounts of inflation (arguably around 2-3%) is considered healthy. Once inflation rises past a certain point, it can lead to a destructive upwards spiral in prices.
When you have runaway inflation or hyperinflation, prices of goods quickly rise to near unaffordable levels. The purchasing power of individuals gets eroded. And quite often, this is accompanied by social unrest. Stark and recent examples include Venezuela, Argentina, Turkey, and more.
Hyperinflation is most commonly the result of misguided macroeconomic policy, the consequences of mismanagement on the part of the ruling party. Although the trigger point or catalyst for a hyperinflation could be due to crises such as the Covid-19 pandemic, or a global financial crisis, proper and prudent monetary policy applied at the right time and magnitude can help save a nation.

Presently, we see that producers in Singapore have not bore the brunt of inflation as much as producers in other markets. Hong Kong, U.S., U.K., and more are all facing much higher levels of inflation. The Producer Price Index (PPI) of 2022 reports show that Singapore is only facing slightly higher prices.

Coupled with the Bubble Index of selected cities, we see that Singapore is on the safer side of the spectrum (low risk of bubble, lower PPI). European and American cities face a lot more problems when it comes to producer inflation and a risk of bubble formation.
However, consumers in Singapore face a moderate level of risk as prices rise on consumer goods. While the Consumer Price Index (CPI) shows a more troublesome time for European and American consumers, Singaporeans might find more trouble on the way if inflation is left to rise on its own.


Another reason why inflation needs to be urgently dealt with when it rises above healthy levels is because of its effect on growth. For real GDP growth to occur, output needs to be able to rise beyond the effects of inflation. Inflation in the form of rising costs, has the potential to erode the earning power of companies.
Poor earnings performance leads to lower growth and eventually poor stock prices as well. These negative effects are most obvious in recessionary periods (see 2007-2012 and 2020-2022 in the GDP growth chart above. Seeing the inflation and GDP growth rates cross over each other in the opposite direction is a sign of the negative correlation during recessions. Otherwise, inflation is typically correlated with healthy levels of growth.

Inflation affects the prices of assets (such as property) but also goods and services, and the stock market as well. The stock market often “prices in” the effect of inflation on companies. Thus, the stock market sometimes acts as a forward indicator of inflationary pressures. Stock prices might rise ahead of inflation and fall before inflation does. This seems apparent in the long-term chart for the Singapore Stock Market and the inflation rate.

As mentioned, property is one of the assets whose price is affected by inflation. More recently, you might have heard of real estate enthusiasts claiming that property is a great hedge against inflation. This statement suggests that property prices and inflation rate are positively correlated. True enough, the chart above on inflation rate and Singapore’s Residential Property Price Index shows in-tandem movement. Although price drops in the property market are a lot more mild.
Singapore’s residential property price index tends to climb with inflation but holds value relatively well, but it moves in tandem with inflation. Because of this nature, we would only know when inflation peaks when the property prices peak before. Even though property is a good hedge against inflation, the index still faces the potential of price declines and long periods of consolidation during and after periods of recession.
As property prices have been climbing rather steadily the past few years, a price decline may come as a surprise to many. The chart above is a reminder to all that after inflation peaks in 2022 or 2023, home prices have an increased risk of falling as inflation slows down. Price would have an increased risk of correction if Cooling Measures are simultaneously implemented with falling demand and inflation. Actual micro demand and supply mechanics will also be an important determinant of housing prices in Singapore.

Perhaps one of the most confusing aspects of inflation is that there are many ways to calculate it. Singapore’s government often uses the MAS Core Inflation Measure, which does not include food and energy prices. In this report, we will use the All-Items inflation number, which puts out a 6.7% Y-O-Y reading in June 2022.

This recent 6.7% inflation number is close to the previous high during the Global Financial Crisis (GFC). It would be extremely worrisome if the inflation rate continues to rise above the previous GFC peak into the 8% range and above. The persistence of high inflation is also worrisome as rising prices of basic goods can spill over into other sectors and affect prices across the economy. Optimists are hoping for inflation to peak later this year and come back down within a healthy level.
The high inflation numbers are driven largely by cost-push inflation. Supply-chain issues and geopolitical instability, which has pushed up energy prices across the world. Singapore is no exception and faces much higher energy prices, such that the CPI for transport increased 18.8% in June 2022 Y-O-Y. Higher energy prices usually translate to higher prices across the board, as every sector in the economy inevitably needs energy as a basic input to function. If high energy prices continue to persist, consumers can expect to pay much higher prices elsewhere as well.

Inflation is the story of the year and an insidious force eroding the purchasing power of Singaporeans. It is definitely an area to watch, with even higher priority than interest rates, GDP, unemployment and other macroeconomic factors. Even the Central Banks around the world are closely monitoring their inflation measures to decide on what is the appropriate response to help curb the rise in prices.
While there is only so much monetary policy can do, inflation and poor economic outlook can push people to cut back on their spending. This helps to “cool off” the economy and reduce the upward pressure on inflation, but in turn it reduces GDP growth. This tough catch-22 situation is what most governments are faced with.
Interest Rates as the Penicillin
Monetary policy has traditionally been the remedy to high inflation and economic troubles. Whenever inflation climbs too high, central banks typically tighten monetary policy in the form of higher interest rates and/or balance sheet reductions. On the other hand, when the economy is exposed to a negative shock (like Covid-19) or suffers the risk of a prolonged recession, central banks engage in quantitative easing in the form of lower interest rates and balance sheet expansion. Governments may also give out stimulus cheques to prop up consumption and demand in the economy before it enters a negative downward spiral.

The extraordinary circumstances of high inflation in the U.S. have pushed the Fed to increase interest rates from near zero levels (~0.25%) to the range of 2.25-2.5%. There have been four rate hikes so far in 2022. This front-loading of interest rates has been much faster than previous cycles of Quantitative Tightening. But most analysts are still of the position that the Fed is “behind the curve”. They acted too slowly as inflation was rapidly rising and are now playing catch-up with interest rates.

Depending on whether inflation can be brought under control, it is quite possible that the high interest rate environment will continue to persist with even higher rates. There are three more Fed meetings this year on September 20-21, November 1-2, and December 13-14. If inflation remains high, it is quite likely that interest rates will continue rising 0.5% to 0.75% with each additional Fed meeting. This could possibly put the interest rate at the end of 2022 to be around 3.75% at the lower bound and 4.75% at the upper bound. The reality might be somewhere in between.
As interest rates rise, home loans would become less affordable for borrowers. Prospective buyers might end up having to take smaller loans, pushing them to go for a specific quantum play. We will be following this situation and discuss more on how this will impact buyers in the following months.

The U.S. Fed is not the only central bank raising interest rates in the world. With the exception of Japan, Russia, and China, most banks are increasing interest rates to fight against inflation but also defend their currency against the tightening of the U.S. dollar. Since monetary tightening by the Fed decreases the supply of the U.S. dollar, other central banks would follow suit if they do not want their currencies to fall against the dollar. Still, the problem of inflation is the more pressing issue. Especially in the U.S. and parts of Europe. We can expect to see interest rates around the world continue to rise so long as high inflation is present.

Looking at the Singapore Overnight Interest Rate (SORA), Singapore’s interest rate situation closely matches the Fed’s decision in the U.S. partly because we are such a small city-state and partly because most markets do so as well. The SORA might lag slightly behind the Fed Funds Rate but still follow considerably close. As the Fed continues to increase interest rates into the end of 2022, we can expect that the SORA will climb in tandem.

Singapore’s interest rate situation is considered far behind the inflation curve, which might take time to remedy. Thankfully, inflation in Singapore is not yet as bad as the U.S. and the SORA is climbing fast in response to Fed hikes. The SORA currently stands slightly above 1.5%. It lags behind the Fed Funds Rate by almost a percentage point but is rising proportionately to the inflation situation in Singapore (and not the U.S.).
What does this mean for the real estate market and people who might be taking home loans? Interest rates are going to continue rising and likely persist. So are housing prices. High inflation is behind both of these. In the short to medium term (1-3 years), market participants looking to get a home loan could consider the option of a short-term fixed rate mortgage.
Since interest rates are expected to rise, locking in the current rates for a period of one to two years might be a rational choice. Refinancing some time after the Fed pivots into another quantitative easing cycle might present homeowners with lower interest rates in the medium term (3-5 years) future. Due to inflationary pressures, home prices are also expected to rise. They might only start to decline or consolidate after inflation falls back to around 2%.
The GDP Situation
As much as the inflation rate affects central banks’ decisions on interest rate hikes, it also affects the GDP situation from the perspective of company growth and consumer spending. The United Nations Department of Economic and Social Affairs (UN DESA) has cut the growth estimates of the global economy by quite a severe margin for 2022 and 2023. While the global economy is still expected to grow on net, a slowdown is still expected.

The GDP situation will differ depending on the market and the economic condition and context each market has. Focusing our attention on the GDP situation in Singapore, only the advance estimates for GDP is available from the Ministry of Trade and Industry (MTI). For the second quarter, Singapore grew 4.8% Y-O-Y but has 0% Q-O-Q seasonally-adjusted growth. The economic slowdown is in its very early stages. Economists have also warned of a much sharper slowdown in the coming quarters. Singapore’s GDP performance on the Y-O-Y basis does not show any phenomenal results or big red warning signs at the moment but the Q-O-Q GDP performance has given some evidence of a slowdown.
Based on the Q-O-Q GDP numbers, The Wholesale & Retail Trade and Transportation & Storage sectors contracted at -0.9% in Q2 according to the advance estimates from MTI. Next, manufacturing only put in a growth of 0.3%, showing signs of slowdown in Singapore’s biggest sector. Cost-push inflation and supply chain issues in the first half of 2022 seems to have stunted growth in these few crucial sectors in both the Goods & Services aspects of the economy.

Despite these worrying signs of an economic slowdown, not all sectors are equally affected. Some sectors are showing resilience in light of the tough macro headwinds. In terms of the contributions to the percentage change in Real GDP, Real Estate, Rental, and Leasing contributed the most to Singapore’s Real GDP at 0.34% (Q1).
On the other hand, non-durable goods manufacturing (-0.99%) and retail trade (-0.64%) are the two hardest hit industries. While this breakdown is based on the Q1 data, we can expect to see similar Q2 results but with greater signs of a slowdown across all industries.

This is not to say that the real estate market in Singapore is immune to the slowdown or the effects of a potential recession. Rather, it is a sign that the housing sector is in relatively better shape as compared to the manufacturing and retail sectors of the economy. In the big picture, this is typically a good sign as housing-led recessions are typically more severe due to its implications for the financial sector and the stability of the debt situation in the country.
If a sharp slowdown or a recession occurs with manufacturing and retail sectors leading the fall, it is more likely that a recovery in demand and remedial measures in maintaining supply chain stability in prices and timeliness would bring the economy back into working order. Thus, the GDP situation is not entirely grim but has some important warning signs for a slowdown in the coming quarters for Singapore.
While a recession is not immediately within the scope of 2022, there is still a possibility of it being announced in 2023 if the coming quarters puts out poor performance of the Singaporean economy. Real estate might not be the worst-affected industry but it will still suffer from the overall dampened demand should a recession occur.
Potential Recession on the Table
A recession is technically refined as having two consecutive quarters of negative growth. With evidence of an economic slowdown in Singapore, a potential recession may be on the table for 2023. We look at the risk of recession in the U.S., China, and Singapore and point out some differences and risk factors that we should consider as the global economy seems to be undergoing a period of strain from cost-push inflation and geopolitical tension.

Talks of the U.S. being in a recession has been a big point of discussion over the past few months. The advance estimate put out by the U.S. Bureau of Economic Analysis shows that the U.S. has had its second quarter of negative growth (chart above). Real GDP decreased at a rate of -0.9%, following a Q1 decrease of -1.6%. This puts the U.S. technically in a recession. These two quarters of negative growth in 2022 is far milder than the Covid-19 recession. The decline in 2022 Q2 is also much milder than in Q1. The coming quarters of economic data would be crucial in helping economists determine the nature of this recession.

Singapore’s economic recovery following the pandemic has been going moderately well. However, it is currently experiencing a slowdown in its growth. The past two quarters avoided negative growth by a small margin. Singapore’s Q2 performance however is not yet out of the woods. Additional estimates and the official announcement of Q2 Real GDP performance could potentially put in a negative number if there were changes to the downside.
The risk of a sharp slowdown in the coming quarters would put discussions of a technical recession on the horizon. Persistent inflation, high interest rates and low growth is a dangerous combination for the economy. We will continue monitoring the persistence on these macro conditions and how it might affect Singapore’s real estate market.

Speaking of the real estate market, China’s economy has recently grabbed headlines with consumers boycotting their mortgages over fears of uncompleted properties as developers stumble into serious debt issues. Evergrande was only one of many property developers that faced financial difficulties. Many analysts have termed the real estate market situation in China as a timebomb. If the financial infrastructure of China cannot find ways to solve the debt crisis in the real estate market, it might pose even bigger concerns for the health of the economy as a whole.
This left some Chinese buyers in despair, desperate for a remedy to the situation. “I thought it would never happen” was a comment made by a buyer caught up in the heated property boom many years earlier. Some buyers ended up having to spend all their salary on rent (because their home is uncompleted) and the mortgage. “I don’t want to pay any more… It’s not that we disregard the law or contracts, but this situation puts us under too much pressure.” This is a reminder for buyers in Singapore to stay prudent and take into account black swan events in 2022 and beyond when planning property purchases.
While the Chinese market is not yet considered to be in a technical recession, it posted negative growth in the Q2 estimates at -2.6%. It also did not fall into a recession during the pandemic. So far, the Chinese market has shown resilience and the ability to bounce back from poor economic conditions. However, the debt situation in the real estate market is more complex and sticky. It might take more than a quarter to untangle the financial, regulatory and social issues in the industry.

It is interesting to mention that China is one of the markets which lowered rather than raised interest rates. This is partially due to the real estate situation. Newly built housing prices in China have been falling since the middle of 2019. The downward momentum shows no signs of slowing thus far. A high interest rate environment would hurt demand and housing prices further, potentially causing an even stronger downward movement in price. However, the effects of lower interest rates on price stability seems to be short-lived. Further downside on the Chinese housing market is expected still.
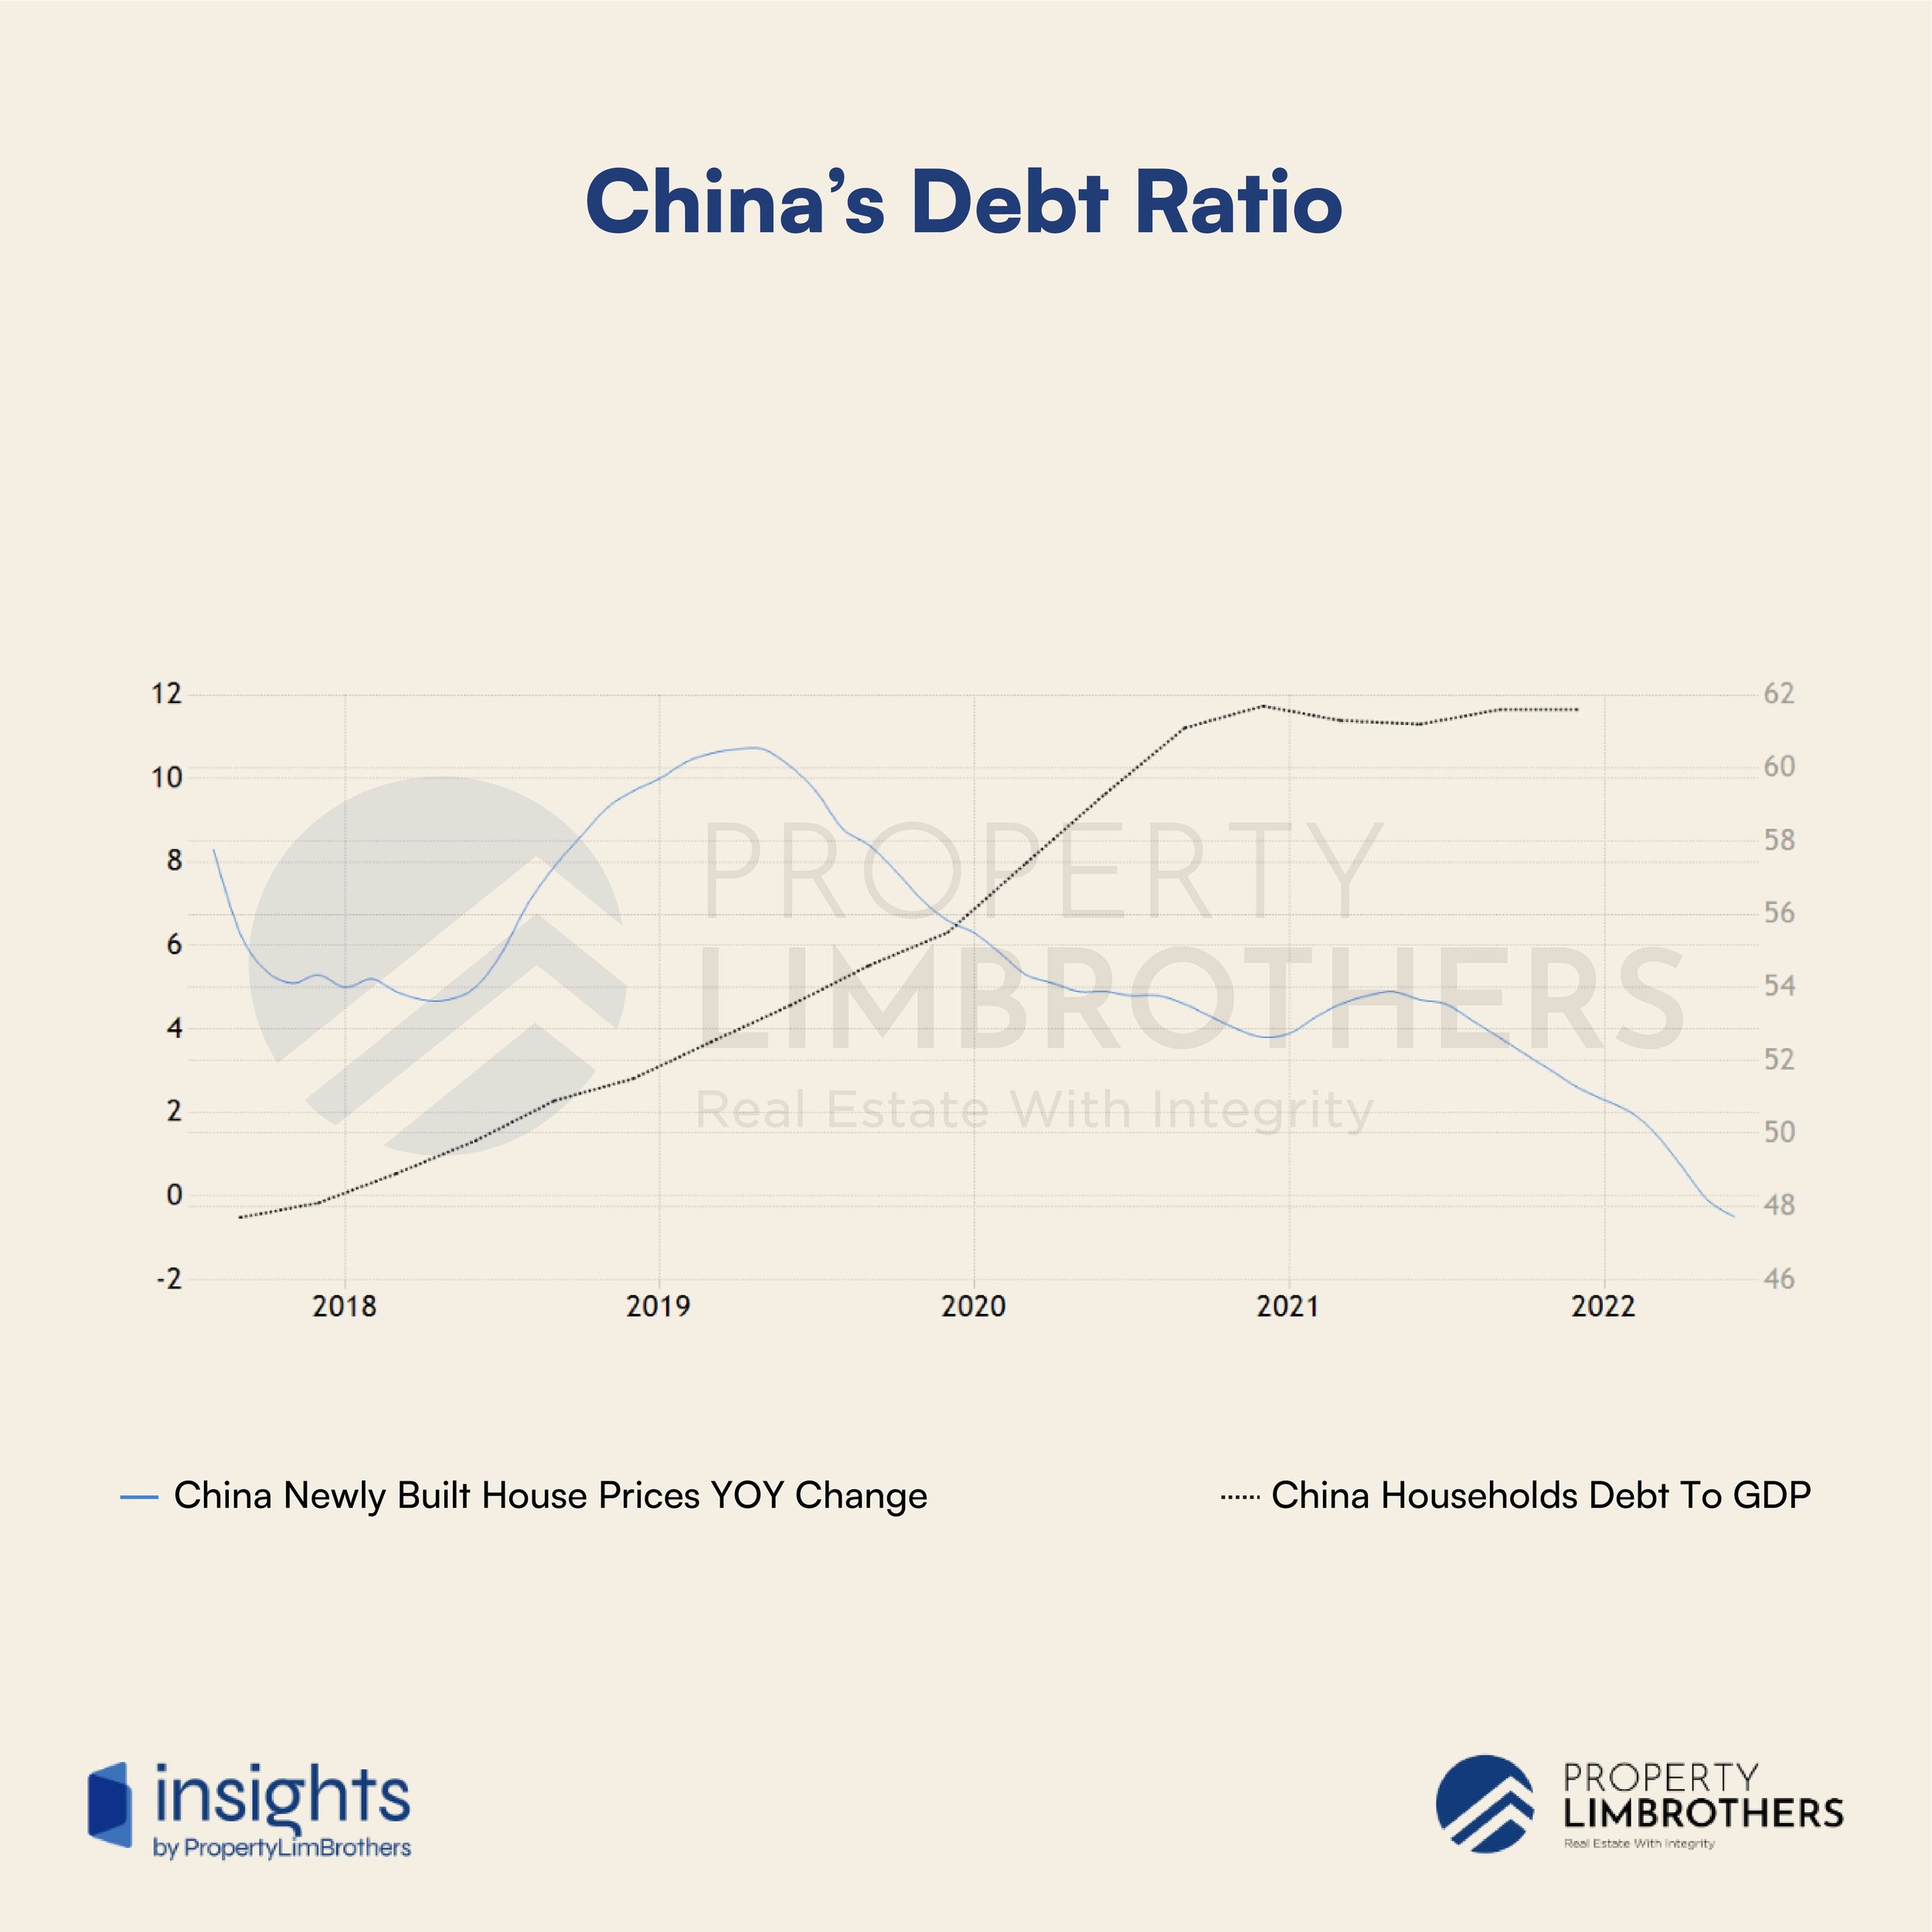
In addition, China’s debt to GDP ratio has been steadily increasing from 2018 to 2020, only stabilising in 2021. The growing public debt is not a concern in China at the moment. Though it is approaching a concerning threshold between mid-60 to mid-70. Beyond this threshold, public debt becomes more costly in terms of economic growth and brings questions on the sustainability of having that much debt.
When should China’s real estate market be a cause for global concern? If China enters a housing-led recession in the next quarter without signs of debt restructuring or policy pivot, it can be interpreted as a warning sign for the financial system there. If default rates continue to rise on both the consumer and developer sides, it is a red flag. The international audience should step up their attention at this point to watch out for the risk of default by financial institutions. Spillovers to international finance would be possible, and is a cause for concern.
Otherwise, the global financial infrastructure is a lot more robust after the 2008 Global Financial Crisis. Should another housing-led financial crash happen on a global scale. We can at least take heart in some of the regulatory requirements for higher reserves that help banks weather tougher financial conditions from default.

Another possible interpretation of the real estate situation in China is that of spillover demand. With Chinese housing prices being unable to hold water, Chinese investor interest in real estate overseas might increase. According to a survey by CMB-Bain, Chinese high net worth individuals have increased their asset allocation abroad two fold from 2019 to 2021. The 2023 estimates put in here seem conservative at best. It would not be surprising to see interest in overseas investable assets rise upon the decline of local Chinese investments.

Even though the macro situation points to possible spillover demand from China, the micro picture shows us that overall foreigner interest is fading. Instead, the Singapore PR segment is the one increasing. We can interpret this loosely as wealthy foreign investors are possibly obtaining PR status.

Particular to Singapore, foreigner interest is expected to rise in the real estate market here. Chinese investors make up one of the largest foreigner segments in this market. Recent bulk buying headlines of Condos in Singapore despite the high Additional Buyer’s Stamp Duty is one unique example of how such foreign interest might manifest itself (from ultra high net worth individuals). Despite this, the total proportion of Condominium and Apartment buyers that are Chinese is falling. The nationalities of buyers in this specific segment are becoming more diversified.
That being said, the risk of a global recession poses an overall negative effect on the real estate market in Singapore. The issue of growing wealth inequality may also be more pronounced over the next few years as property prices continue to rise due to resilient demand and lagging supply. Overall, the Singaporean demographic is still the most important driver, with more than three quarters of the market transactions being made by Singaporeans.
Unexpectedly Low Unemployment for Worrisome Times
The White House in the U.S. is in denial of a recession. Voices on social media have pointed fingers at their leaders for the attempt to change the definition of a recession. There are merits to both sides of the debate. First, the U.S. economy has undoubtedly contracted for two consecutive quarters. Past recessions have always been associated with unemployment. Both in data, and in the minds of the populace. Yet unlike other recessions in the U.S., unemployment rates are unexpectedly low, at around 3.5% in the month of July.

The U.S. Bureau of Labor Statistics announced on 5 August 2022 of a non-farm payrolls increase of 528,000, which beat market expectations. The strong labour market is often taken as a good sign of economic health. Yet, this will ironically add to the urgent problem of inflation in the U.S.
An important caveat to put out here is that the unemployment rate is not a forward indicator of how the economy will perform. Rather, it is a lagging indicator. Unemployment rate may rise unexpectedly fast in the face of a crisis. The Covid-19 pandemic is an example of how unemployment can soar in a very short period. Likewise with the Global Financial Crisis of 2008.

Zooming into the Singapore economy, unemployment rate is also at a low of around 2.1% in June according to the advance estimates by the Ministry of Manpower. The strong performance on the employment situation may put most people at ease in an “recession out-of-sight, out-of-mind” way. We would like to remain conservative on this point and state that the situation on employment may change in the event of a recession.
When real GDP growth slows, businesses will start looking at ways to cut costs. With inflation worsening this problem, we might see a growing wave of unemployment in the near-future. Yet, the present situation does not give us any warning signs as to the lack of jobs or employment opportunities for both local and foreign workers.
We monitor the employment situation in Singapore closely because this macro metric is an important indicator of the ground situation. Higher unemployment rates signal potential issues with consumer spending, disposable income, and social unrest. These factors are equally important on the micro-side of the picture. Buyers and Sellers in the residential housing market in Singapore are predominantly driven by the strong middle class, HDB upgraders.
A worsening employment situation in Singapore will be very bad for families. The loss of income will be more impactful to families on top of the rise in the price of goods and services. This will be the most ‘felt’ economic metric by people on the ground.
The Macro Picture as a Whole
As a whole, the macro picture presents Singapore with many economic headwinds. High inflation and interest rates. Contracting GDP. And a non-negligible chance of a recession. Generally speaking, these are signals of more pressing times ahead for businesses and some individuals. However, not all of these factors have negative implications for the real estate market in Singapore.
Inflation technically helps to increase the price levels of housing. However, higher prices coupled with higher interest rates might hurt affordability. Prices may indeed go up but the number of people willing to pay those prices will typically shrink the higher up it goes.
In contrast, contracting GDP and the possibility of a recession might push people to cut back on spending, which includes decisions on big ticket purchases such as a home. Lower growth on the business end will also eventually lead to increased unemployment if businesses cut back on labour expenses.
To summarise, the current outlook for Singapore’s real estate market is still positive in terms of price performance. However, transaction volume and transaction speed would likely experience a slowdown. Based on the macro influences, real estate prices face an elevated risk of decline if inflation returns to a normal level with high interest rates still, and if a recession is declared with unemployment starting to rise.
Singapore Housing Prices over Past Recessions
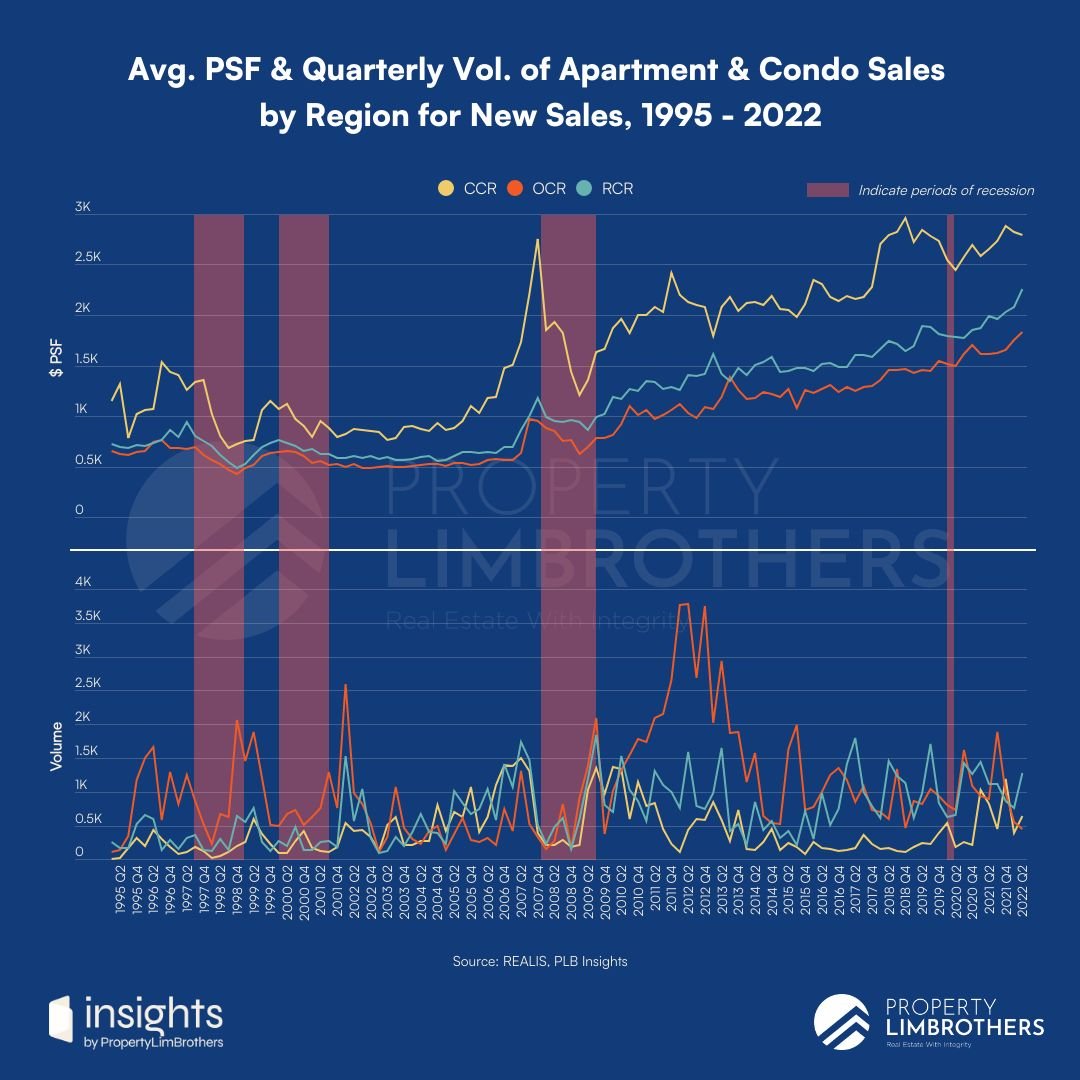
We now analyse the micro situation in Singapore’s housing market over previous recessions. This is a special focus of PLB’s Q2 report. The shaded regions are periods of past recessions. Starting with the Asian Financial Crisis (AFC) around 1998, the Dot.com Crash around 2001, the Global Financial Crisis (GFC) around 2008, and the Covid-19 Recession in 2020. We analyse how it affects the new launch and resale property markets on different charts.
Prior to previous recessions, the volume of transactions usually tapers off and starts declining. As the recession enters periods of negative GDP growth, the average PSF of non-landed new sales typically falls as well. Interestingly, cooling measures did act on the new launch market in a similar fashion. The volume of transactions from the 2013 to 2019 period was relatively more stable as compared to 2010 to 2012. New launch prices were relatively stable throughout the introduction of many cooling measures from 2009-2014.

In terms of the decline, the average drawdown during a period of recession is 23%. If we take the average of the annualised numbers, market participants should expect an annual contraction of 18%. The price decline could be rapid as seen in the 2008 GFC, with a sharp reversal once prices have hit the peak. This might be due to the housing-led recession during that period. In other recessions, the average PSF of new launches will start to show signs of a decline for a few quarters prior to the recession.

Looking at the regional breakdown of new launches, non-landed new sales in the CCR is typically the most affected with an average annualised decline of 24%. The magnitude of decline in OCR and RCR new sales is mixed, with a comparable average annualised decline of 14% and 12%. The OCR prices form a steady level of support for the RCR launches. Importantly, in the recent quarters, the regional price disparity has been kept in check, with RCR and OCR prices keeping pace with the CCR increases. This signals a more sustainable price inflation as compared to the housing bubble of 2008.

The resale market for non-landed homes follow a smoother trendline with much less volatility in price and volume. This is expected as the deal flow within the resale market is more regular as compared to the punctuation between different new launches. However, the pattern of decline over the past recessions are more regular, with more centrally located properties suffering a larger decline in prices. The CCR, RCR, and OCR faced an average annualised decline of 18%, 15%, and 11% respectively during the recession periods.
The CCR resale non-landed homes maintains a strong lead above RCR and OCR prices ever since the GFC. The regional distinction in prices is expected to remain strong, with regions further away from the Central areas acting as strong support prices with high demand for more central homes. For instance, if the CCR prices are in parity with the RCR prices, demand for CCR would surge as RCR consumers spillover to buy CCR properties instead.

In contrast to slicing the data by region, the disparity between new launch and resale non-landed homes have grown incredibly huge since the recession. Supply of new homes are unable to keep up with the demand, making new homes scarce and their prices a lot more expensive than resale options. Over the past recessions, the gap between new launch and resale prices closes quite rapidly. New launch buyers take the more prudent option of buying resale properties instead. At the present moment, new launch prices (especially CCR) can be vulnerable to a severe correction in the event of a recession.
A slowdown in the number of transactions over the past few quarters is concerning as it is similar to the topping pattern prior to recessions in the past. If the property purchase or decision to upgrade the current property is not urgent to market participants, it is highly encouraged to take a “wait-and-see” approach, or to take a very strategic and conservative value play. Risk levels for new launches at the current prices are too high, and largely driven by inflationary pressures. A better entry point would be when inflation has cooled back down to a normal level of around 2%.

OCR properties in the non-landed new homes segment make up a large portion of the market by volume. The discrepancy between different home sizes is less stark due to the larger pool of options for buyers. Nonetheless, the price disparity between differently sized homes is growing and is expected to continue to do so.

The RCR and CCR charts exhibit a similar trend. Though, the volatility and price disparity between different size homes is amplified as we get closer to the central area. The volume for CCR transactions for non-landed new home sales is marginally less compared to the RCR category but exhibits a much higher level of upside volatility for homes greater than 1,500 square foot. This could be attributed to scarcer large non-landed homes in the CCR area and/or signal a possibility of high prices at new launch in the CCR.

Among the different regions, the CCR price disparity between different sized homes is most affected by recessions. This might signal the demand volatility of the luxury home market during recessions. In contrast, the price gap between different sizes in the OCR and RCR displayed a similar level of stability even during recessions.
From the charts we have analysed, more central regions have a higher vulnerability to a recession. Price volatility to the downside is more likely for centrally located properties. Likewise for new sales of non-landed homes, the gap with the resale prices have grown to a very large margin. There is a higher risk of a price correction for the non-landed new sales market should Singapore enter a recession. When new launch prices reach parity with resale prices, it presents a great value entry.
Geographical Distribution of Performance, Price, Supply
We now focus our analysis on the geographical differences in recent performance and supply from 2019 to 2022. For performance, we look at the compound annual growth rate (CAGR) of the average PSF by district. The CAGR measure is used here to smooth out the year-on-year volatility in growth rates to get a more stable measure of growth and to make the returns on investment in property comparable to other asset classes that people traditionally invest in.

Overall, prices exhibit relatively stable growth in the western and northern parts of Singapore. Districts in the OCR have mostly enjoyed moderate growth, and have an average CAGR of 2.7%. Likewise, with the RCR, the recent 3 year performance is at a decent CAGR of 3.9%. However, the CCR has the most volatility. Districts within the CCR vary a lot in performance; the performance gap in the CCR is more pronounced. The strategic choice of property purchase would matter more in Central settings relative to the OCR thanks to this spatial difference in performance.

We summarise the top 5 districts by CAGR in the tables above. The top performing district is district 6, in the City Hall and Clarke Quay area coming in with a CAGR of 17.23% since 2019. The average PSF of D6 non-landed properties is held at $2,923 with a total transacted volume of 682.
The CAGR of the other top districts fall off rapidly with D8 (Little India, Farrer Park, Serangoon Road) at 10%, D27 (Sembawang, Yishun) at 7.4%, D22 (Lakeside, Boon Lay, Jurong, Tuas) at 6.9%, and D12 (Balestier, Toa Payoh, Serangoon) at fifth place with a CAGR of 6.4%.
Out of the top 5 districts, 2 were from the OCR and 1 from CCR and 2 from RCR. While it is true that the top two were more central districts, the volume of transactions that reach these high levels of returns is less than half of the OCR top districts. This insight coupled with the fact of lower volatility in OCR on multiple different dimensions, and reasonable resale prices puts into focus OCR resale properties, which we will cover in a later section.

Apart from the returns in the form of CAGR, we look at the price gaps between regions across time. We further segment this by the nature of the lease (freehold or not) but include landed properties and exclude HDBs. Our price gap charts also take into account all sales. For freehold properties, the price gap between the RCR and CCR is small as opposed to the OCR’s gap with RCR/CCR. This price gap has continued to widen even since 2004 and shows no signs of abating. Even during periods of price correction, the gap merely stabilises but doesn’t close.
This can be interpreted as a form of wealth disparity led by concentrated demand for more central properties in combination with a higher supply of new properties in the OCR. The gap may be stabilised as the government introduces more residential supply to the RCR and CCR regions. Alternatively, these price gaps could also reflect how more premium is placed on central freehold properties as a matter of buying preference.
Wealthier buyers who are looking for a freehold property would be more inclined to buy one closer to central areas since they are already spending more. The expectations of freehold properties’ growth might also be closely tied with its more central location. The small gap between CCR and RCR price levels for freehold properties might be due to the issue of limited supply, causing them to be closely substitutes for a much larger pool of buyers.

Contrary to freehold property, leasehold properties have much less stability in price gap. The gap between the RCR and the CCR is also more pronounced in leasehold properties. This means that for leasehold properties, RCR and CCR are not close substitutes for buyers, possibly due to the much larger pool of options available. That being said, the RCR and CCR gap has been starting to close and is on the point of inverting as it did before 2003.
When RCR average PSF inverts above the CCR average PSF, a possible reason is because of the high unit price in Bukit Merah, Kallang, and Bishan (RCR). When a majority of the transactions come from those 3 neighbourhoods, unit prices of these 3 areas may be higher than the unit price of Bukit Timah (most of the transactions in CCR come from here), thus allowing the RCR to invert above the CCR in some quarters for leasehold properties. The inversion ended in 2003 as the Downtown Core developed its residential side, unit price and volume increased rapidly, pushing prices back above the RCR price levels.
These regional gaps in price for both leasehold and freehold properties seem to confirm that RCR properties benefit the most from price gap fluctuations. In the freehold context, the widening price gap favours the RCR. Whereas in the leasehold context, price gap volatility can potentially favour RCR properties if they were acquired when the price gap between CCR and RCR properties are larger.
However, the current price levels of both CCR and RCR properties are becoming increasingly unattractive relative to OCR properties. As the price gap continues to increase between regions, the likelihood of government intervention in the market increases as well. Supply in the form of government land sales may be adjusted to alter price trends in the future. Presently, the government already intends to increase the supply of RCR and CCR residential properties.
At the moment, we place more focus on the OCR due to the reasons above. In the future, the RCR may be an interesting segment to watch as we enter an economically uncertain time in the world.

Turning our attention now to the spatial variation for supply, the available stock varies geographically by quite a substantial margin. Available stock for non-landed is most concentrated in the Holland, Bukit Timah, Sixth Avenue, Farrer Road area (part of D10), and around Punggol, Sengkang, Hougang (D19). Non-landed available stock is the least across the southern segments of Singapore such as Queenstown, Tiong Bahru, Little India and CBD areas.
Putting this together with the CAGR data, we can infer that supply shortage in the form of low available stock does not translate into higher growth. However, it does correlate with a higher price in the form of higher PSF. The relationship between supply and growth is not straightforward, and much of the growth dynamics is also reliant on location-based demand.

According to the URA’s latest update on Q2 performance, 2023 will see the biggest spike in stock of completed private properties. This coupled with the macro factors of slowing markets may put a dampener on resale prices in the coming year as sellers looking to exit their Condominiums & Apartments upon TOP may flood the resale market. Nonetheless, Singaporeans have strong holding power. If prices are not favourable, it is quite likely that the resale market will continue to inch up or stabilise at higher levels with gradual volume.
The subsequent years (2024 onwards) will see a gradual reduction in added supply to the resale market, which may present a better opportunity for sellers down the road. This timing would likely align with the Fed pivot into lowering interest rates, which would be favourable for buyers, pushing up demand for housing due to the lower cost of borrowing.
In order to contextualise the supply of real estate in Singapore, our next section will explore how government land sales (GLS) vary by regions. We will attempt to breakdown inventory levels and postulate how floating supply levels would affect price in the near future.
Supply of Housing & Potential Changes
The supply of housing fluctuates based on the government introduction of land sales. New supply into the market is predominantly a matter of policy. Whereas existing inventory levels or the floating supply of housing is more influenced by market forces. Importantly, the GLS is typically sensitive to the housing situation in Singapore. URA has been both responsive and forward-looking to the market conditions in the real estate situation in Singapore. We interpret GLS as a historical explanation for current or future housing prices.

The GLS over the past 22 years gave us a peak from 2010 to 2013. This distinct peak that we see on the chart above is mostly located in the OCR. GLS in the RCR during this period was also moderately substantial. This oversupply situation in conjunction with cooling measures was what dampened prices during that period. It also marginally increased the price gap between OCR and other regions for a short period of time.
More importantly, the oversupply of housing during that period was thought to be a policy error resulting in a supply glut of HDBs and private housing. This put the resale market through a period of stagnant prices. However, it is impossible to distinguish whether it is mostly because of the cooling measures or the supply situation. For the resale HDB market at least, it can be attributed more towards the oversupply issue of too many new flats being introduced in the early 2010s.

Cumulatively, we can see that the steep slope of GLS in the OCR tells us that the speed of the new supply being introduced was rapid. The market eventually responded through a long period of price consolidation. While this kept residential housing affordable, it hurt the short-term prospects of returns.
Presently, the housing market is entering a period of undersupply due to both the disruption from the pandemic and the shrinking GLS. Arguably, the GLS was paused for too long a period of time following the supply glut situation. Due to a time lag of around 4 years for development, it is difficult to estimate the right amount of supply to introduce to the market. Regardless, construction delays from the pandemic and persistent logistical issues have worsened the situation.
The GLS might have been tapered for too long, resulting in a reverse situation of undersupply. Now coupled with delays caused by the pandemic, it resulted in the price of housing rapidly increasing over the past two years. Contributing also to the higher prices is not only the amount of land being sold but also the rising land prices sold by the government. These three factors together are the main reasons for housing inflation and shortage in Singapore.

Given by the chart above, CCR land prices have increased disproportionately higher than the RCR and OCR. On the other hand RCR is only marginally higher than OCR in terms of price with a similar rate of increase. The policy stance on land sales is not to generate revenue for state-use, but rather for the developmental needs of the physical estates. The price of GLS, however, is governed by a bidding process. Thus, the price trends we see on the chart are a result of the demand from real estate developers. Higher land prices might have also contributed to the lower CAGR of properties in CCR districts .

The total unsold units in the condominium and apartments segment is falling and nearing the previous low of around 20,000 units during 2018. The low number of unsold units may be a reflection of an undersupply or overdemand situation. From a historical perspective however, these levels of unsold units are considered very low.

The CCR presently has a moderately high transaction volume compared to the recent 15 years. Total unsold units are declining but have not reached the previous bottom around 2019. The CCR has more unsold units compared to other regions, and this might be because of much higher prices. Nonetheless, from a historical lens, the condominiums and apartments in the CCR are still doing well.

The RCR is faced with declining volume of transactions along with declining total unsold units. The decline of total unsold units is of great magnitude as the floating supply built up from 2018-2020 is almost completely taken up. The OCR faces a similar situation with a much stronger decline below the 2018 lows in terms of total unsold units. OCR however does have declining volume over the past few quarters. These charts in combination paint the picture of a much tighter situation in the OCR and RCR rather than the CCR.

Will unsold units start to rise again or will this low floating supply stick around for a little longer? Given the declining volume of transactions in addition to the tougher macro conditions, unsold units will start to rise with interest rates and inflation. This might reverse the trend on unsold units into 2023.
This is just a speculation that the demand will be dampened largely by macro factors. If the HDB upgraders or first time property buyers continue to choose condominiums and apartments over resale ECs, HDB and BTO, the unsold units will probably remain at low levels.
In order to get a clearer picture of the direction that housing inventory is headed, we take the next section to elaborate on the demand-side story. Paying particular attention to the problem of declining volume at high prices, which is typically associated with a topping pattern.
Sustainability of Demand & Price Supports
Is there exuberance in the property market at this moment? Prices have been on the rise since the pandemic. Which is typical of most recoveries from recessions. Nonetheless, the housing prices follow an inflationary trend and price growth has been relatively stable since cooling measures were introduced. However, will demand still be as resilient at higher price levels? What else is supporting the price at the current or even higher levels?
Reiterating our analysis of the price movement in the market thus far, the condominium and apartment market still have enough steam for further upside in the short-run. This is particularly true for RCR and OCR properties with relatively lower floating stock as compared to CCR properties. The price disparity is overextended with slight declining volume, which can be interpreted as weaker demand at higher prices.
Nonetheless, quarter 3 of most years exhibit much higher seasonal volume. As an additional signal, if the volume decline continues into quarter 3, the risk of a price correction in the residential property market will elevate. OCR will continue to be a form of price support for more central properties. Prices continue to rise, OCR or less central properties will gradually be perceived as more attractive and affordable. Value-oriented buyers would be more likely to choose properties in such areas. This might partially be the reason why 3 out of 5 top performing districts were from the OCR.

Another vital price support for a continued increase of property prices is the rental market. Looking at the rental prices in conjunction with macro movement (interest rate SORA), there is a loose relationship between the two. Interest rates can be interpreted as the cost of borrowing for consumers. The higher interest rates are, the more costly it would be to buy a house (mortgage will be higher with bigger interest payments). Subsequently, renting becomes a relatively more attractive option. Landlords may pass down higher costs to tenants, as a result causing a lag effect on rental price increase.
In other words, higher interest rates will increase rental demand in the short-term and increase rental price in the medium-term. Rental prices have been rising the past few quarters, but not just because of higher interest rates. In reality, rental options are commonly chosen when property purchasing timelines are misplanned, or when construction is met with unexpected delay.
More importantly, rental is an important price support for property prices. It should rise in tandem with property appreciation and support prices via higher rentals. This would go in line with higher mortgages due to higher interest rates or higher average prices. If rental prices start to decline ahead of, or in tandem with property prices, it signals a correction.

Alternatively, luxury markets such as the Landed segment is a more sensitive and volatile market. They could be used in conjunction with other measures as a form of signal of overall market strength. Sharp decline with receding volume would not be a good sign of the health of the bull market in real estate. This way of reading the market is similar to looking at how “smart money” moves in the property market.
Interestingly, in the worst quarter of 2020 (Q2) by volume, Detached and Semi-detached house prices tanked while Terrace house prices went up. Assuming that this is unique to poor performing markets, similar price action in the future might show a similar trend. The logic behind this price movement may be that Terrace houses are still the largest sub-segment among Landed properties. Relatively higher volume, options, and prices might lead buyers to go with a more “mainstream” choice for landed property in uncertain times.
Overall, current prices in the property market are not in immediate risk of correction. Tight floating supply coupled with a strong inflationary trend is supporting the current price levels. However, the medium-long term view of the property market may have some risk of a correction based on the different scenarios we have laid out in the past few sections.
In Focus — OCR Resale Non-Landed Leasehold Properties
We focus on this particular sub-segment of OCR Resale Non-Landed Properties for multiple reasons. First, as we have discussed in the previous segments, the price gap between the OCR and other regions have grown substantially and risk a correction as price levels continue to rise. The top districts for CAGR also feature a healthy number of OCR districts with strong volume.
Secondly, the price gap between Resale and New Launch non-landed properties have also grown too large. Historically, there has been significant corrections to the prices of new sales, bringing it much closer to resale price levels. Thus, the resale segment will be a less risky choice in terms of the severity of a price correction if it happens.
Next, the non-landed properties encompass a much larger part of the market. In line with the data we presented in the report, the condominium and apartments segment is a key part of the non-landed property category. It addresses a broader audience as it does not have the same limitations and regulations as HDBs.
Lastly, leasehold properties in the OCR are the most common type of resale non-landed. Not just because of the scale, but also because the freehold category shines more in central regions and not as much in the heartlands.
In this final in-focus section, we highlight this particular segment as an opportunity space for short-medium term. The two strong pillars that back our thesis are the concepts of relative affordability and risk management. OCR presents a few districts that offer high growth on top of these two core pillars. D27 (Sembawang, Yishun), D25 (Woodlands, Admiralty, Kranji), D22 (Lakeside, Boon Lay, Jurong, Tuas), and D23 (Choa Chu Kang, Bukit Batok, Hillview, Bukit Panjang) are key districts to pay attention to.
The fundamentals that guide higher price growth are the North-South Corridor and Thomson-East Coast Line for D27 and D25. With further connectivity expansions with neighbouring Malaysia. D22 will benefit from the future developments of Jurong Region Line and Jurong Lake District. D23 will benefit from the continued residential estate developments and focus on greenery and more amenities for the community. These strong fundamentals in the future development of the North, Northwest, and Western parts of Singapore will help guide prices upwards.
Apart from the future developments, technical analysis on the price shows a greater potential for growth due to large price gaps between the OCR and other regions. Furthermore, OCR prices form the core support for the RCR and CCR prices. It has relatively less volatility compared to the RCR and CCR as well as less downside potential. That being said, upside opportunities are not limited. Price growth of OCR districts have been stable with a lot of room to increase as inflationary pressures kick in.
The macro picture supports this in-focus choice of OCR non-landed properties. With macro headwinds still in the picture, OCR properties will make a more prudent choice for property buyers. Sellers may look to capture profits but will be faced with gradually declining demand and transaction volume at high prices. Especially so in the RCR and CCR regions. The sales process might take longer due to less willing buyers on the market.
In addition, the inflationary trend may benefit the real estate market for now. But when inflation declines and is headed back within the normal range, property prices may face a correction. The correction is expected to be less severe for the OCR. Rising interest rates and property prices will also put affordability as an issue with growing importance. OCR properties will fit the bill and take in more buyers who were previously considering RCR and CCR properties.
We will now focus on the four top performing OCR districts by CAGR and compare their performance with each other and with the RCR and CCR. The analysis will be focused on price, volume, and simple growth trends.


For District 27 in the Sembawang and Yishun area of the north, we see a strong move up in price from the pandemic. It made a total growth of 27% over the past 2 years since the pandemic. And 22% if we compare it to the first quarter of 2019. Volume has approximately doubled since.
D27 achieved top CAGR (7.7% from 2019 to 2022Q2) among OCR districts. Interestingly, prices during the pandemic rose despite a volume drop in 2020Q2 and price dropped with much higher volume in the subsequent quarter. D27 Condo prices have risen substantially since. Most notably, the 2022Q2 shows strong volume and price performance despite macro uncertainties.

District 25, which covers the Woodlands, Admiralty, and Kranji areas in the north, we see a much stronger growth number compared to D27 due to a price correction during the pandemic in 2020Q2. The price has appreciated 41% over the past 2 years due to this trough. Since 2019, it has a lower growth rate at 16%. It achieved ninth highest in CAGR at 4.9% as the CAGR performance was dampened by the decline leading into the 2020 pandemic. Recent growth trajectory has tapered and looks more linear as compared to D25’s exponential-esque growth.

In the west, District 22 (Lakeside, Boon Lay, Jurong, Tuas) has a growth trend more similar to, but marginally weaker than D27 (Sembawang, Yishun). From 2022Q2, prices have grown 24% over the past 2 years. From the beginning of 2019, the growth rate is slightly lower at 21%. D22 also performed extremely well with a CAGR of 6.9%, the second highest performance in the OCR.
Arguably, D22 has the strongest fundamental outlook based on the URA Long Term Review. Should the development of the Jurong Lake District and Jurong Region Line succeed with high demand and utilisation for the amenities, the growth outlook for properties within this district will be strong (particularly for resale leasehold condominiums and apartments).

District 23 (Choa Chu Kang, Bukit Batok, Hillview, Bukit Panjang) in the north west area of Singapore has a growth of 19% since 2019 and a CAGR of 6.9%, tying with D22 for second. From the pandemic quarter of 2020Q2, growth sits at 8%. This is due to a very interesting and anomalous strong performance during the height of the pandemic. In fact, it was only recently over the past 4 quarters that prices started to hit around the pandemic high of D23. Growth pattern appears to be linear in the post pandemic recovery.

We group and compare the districts by general geographical area. North (D25, D27), Northwest (D23) and West (D22). Growth rates were relatively comparable but price levels are clearly segmented. North areas form the price base for the OCR. Northwest areas sit slightly above the North and below the West. From an affordability and risk management perspective, certain Condos in the North may offer great value with a risk of a less severe correction, if it does happen.

From the volume of transactions for these four OCR districts, North and Northwest areas perform strongly. Condos in the West have slightly lower volume. In terms of momentum and growth, North areas perform strongly as well. It shows the least risk of a demand shrinkage at higher prices. This makes sense when coupled with the fact that it is the price base for the featured performing OCR districts.
When property prices rise, more affordable options will appear more attractive, and attract more demand. Sembawang and Yishun may have been rumoured to be a low-growth North Corridor region but current fundamentals and technicals show that as an “affordable among affordables” district with strong CAGR give evidence of the contrary.

Now comparing these four OCR districts together against RCR and CCR regions, we see a clear price convergence trend. With the price gap narrowing between the featured OCR districts and more central areas. Since 2019, featured OCR districts grew 20%, RCR grew 12%, but the CCR has a negative growth of -10%. Note that the comparison is made with resale leasehold condominiums and apartments in RCR and CCR (same property type as the one in OCR). This recent trend supports our thesis of featured OCR districts as a prime opportunity space for a growth and value oriented play for property investment and for own stay.

The volume chart of the featured OCR districts, compared with RCR and CCR, shows the much higher volume in the featured OCR and RCR. This might have assisted with the positive growth trend. RCR has surprisingly strength in volume, at similar levels with the featured OCR districts alone. This makes the featured OCR segment a comparable foil to the entire RCR by volume for resale leasehold condominiums and apartments.
Finally, we look at two other OCR districts due to common queries we have received from prospects and clients. District 19 (Hougang, Punggol, Sengkang, Serangoon Gardens) has the highest transaction volume among OCR districts (2019-2022) and is a commonly mentioned area in conversations on residential property. District 28 (Yio Chu Kang, Seletar) is another part of Singapore’s Northeast area that has received some growing attention from market participants.

D19 (chart above) performed well with strong volume to finish off quarter 2. It has a good CAGR of 6.5% across the 3 years with 2019 pulling down the growth performance prior to the post-pandemic inflation in property prices. D28 (chart below) performed similarly with a CAGR of 6.6%. Despite the lower growth rate when looking at the prices in 2019Q1 and 2022Q2, performance was marginally more consistent, hence the similar CAGR.

Together, the Northeastern areas are comparable to the Northern areas in terms of general growth rate. The volume transacted in District 19, however, is not to be ignored. This strong volume can be indicative of a desirable neighbourhood for residency. While the owners of the real estate in this area might churn at a higher rate than the rest of the OCR, the healthy volume of transactions is a good signal of continued price growth. The market accepts current prices with a high number of transactions, allowing asking prices to continue to elevate.
Tying this up with the rest of the OCR performance, District 19 (Hougang, Punggol, Sengkang, Serangoon Gardens) will be a key district to observe the strength of the resale OCR leasehold condominium market. As it is the strongest district by volume, a weaker demand in D19 will not be a good signal for the rest of the OCR performance unless there is some unique driver for growth in other OCR districts.
The in-focus section concludes with the thesis of Resale Leasehold OCR Apartments & Condos as key areas of value and growth in the short-medium term. Taking into consideration both macro headwinds, trends, and micro performance variations, OCR districts emerge as the logical play for affordability, risk management, value and growth. In the following months, we will focus on each of these OCR districts and feature top performing projects based on the transactions over the past 3 years. Look forward to future editorial pieces that will cover this analytical direction.
Caveats & Disclaimers
The insights generated from our report are reliant on the data providers we have used in the process of producing this report. The accuracy of this report is reliant on the data integrity of the relevant data providers.
Any information found in this report does not constitute financial or real estate advice. Please do your own due diligence before making any financial commitments to any related investments or property decisions. Consult the relevant professionals to make sure that you have a proper understanding of your financial situation and that the decisions made are to your own personal best interests.
If you wish to get in touch with our real estate experts, you may contact us here. We are more than happy to discuss the contents of this report in-depth, and how it relates to your personal property journey.