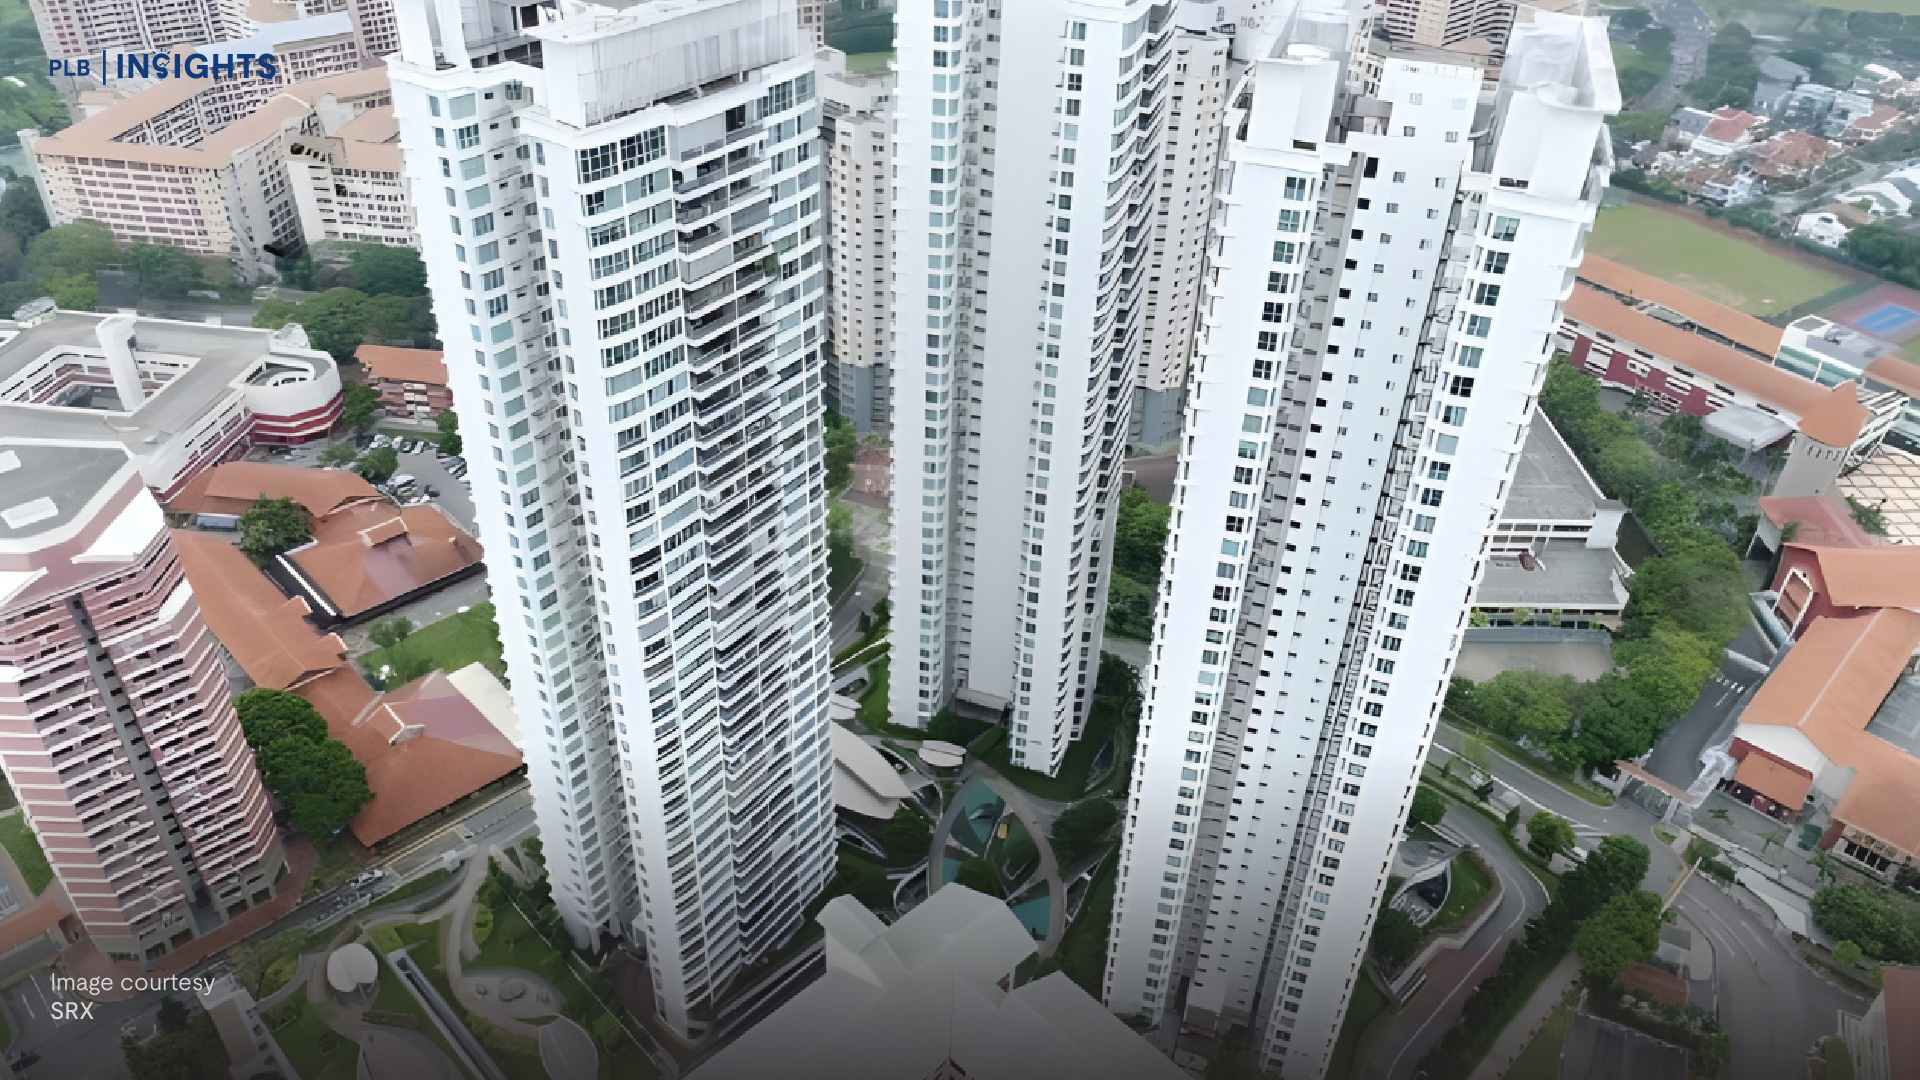
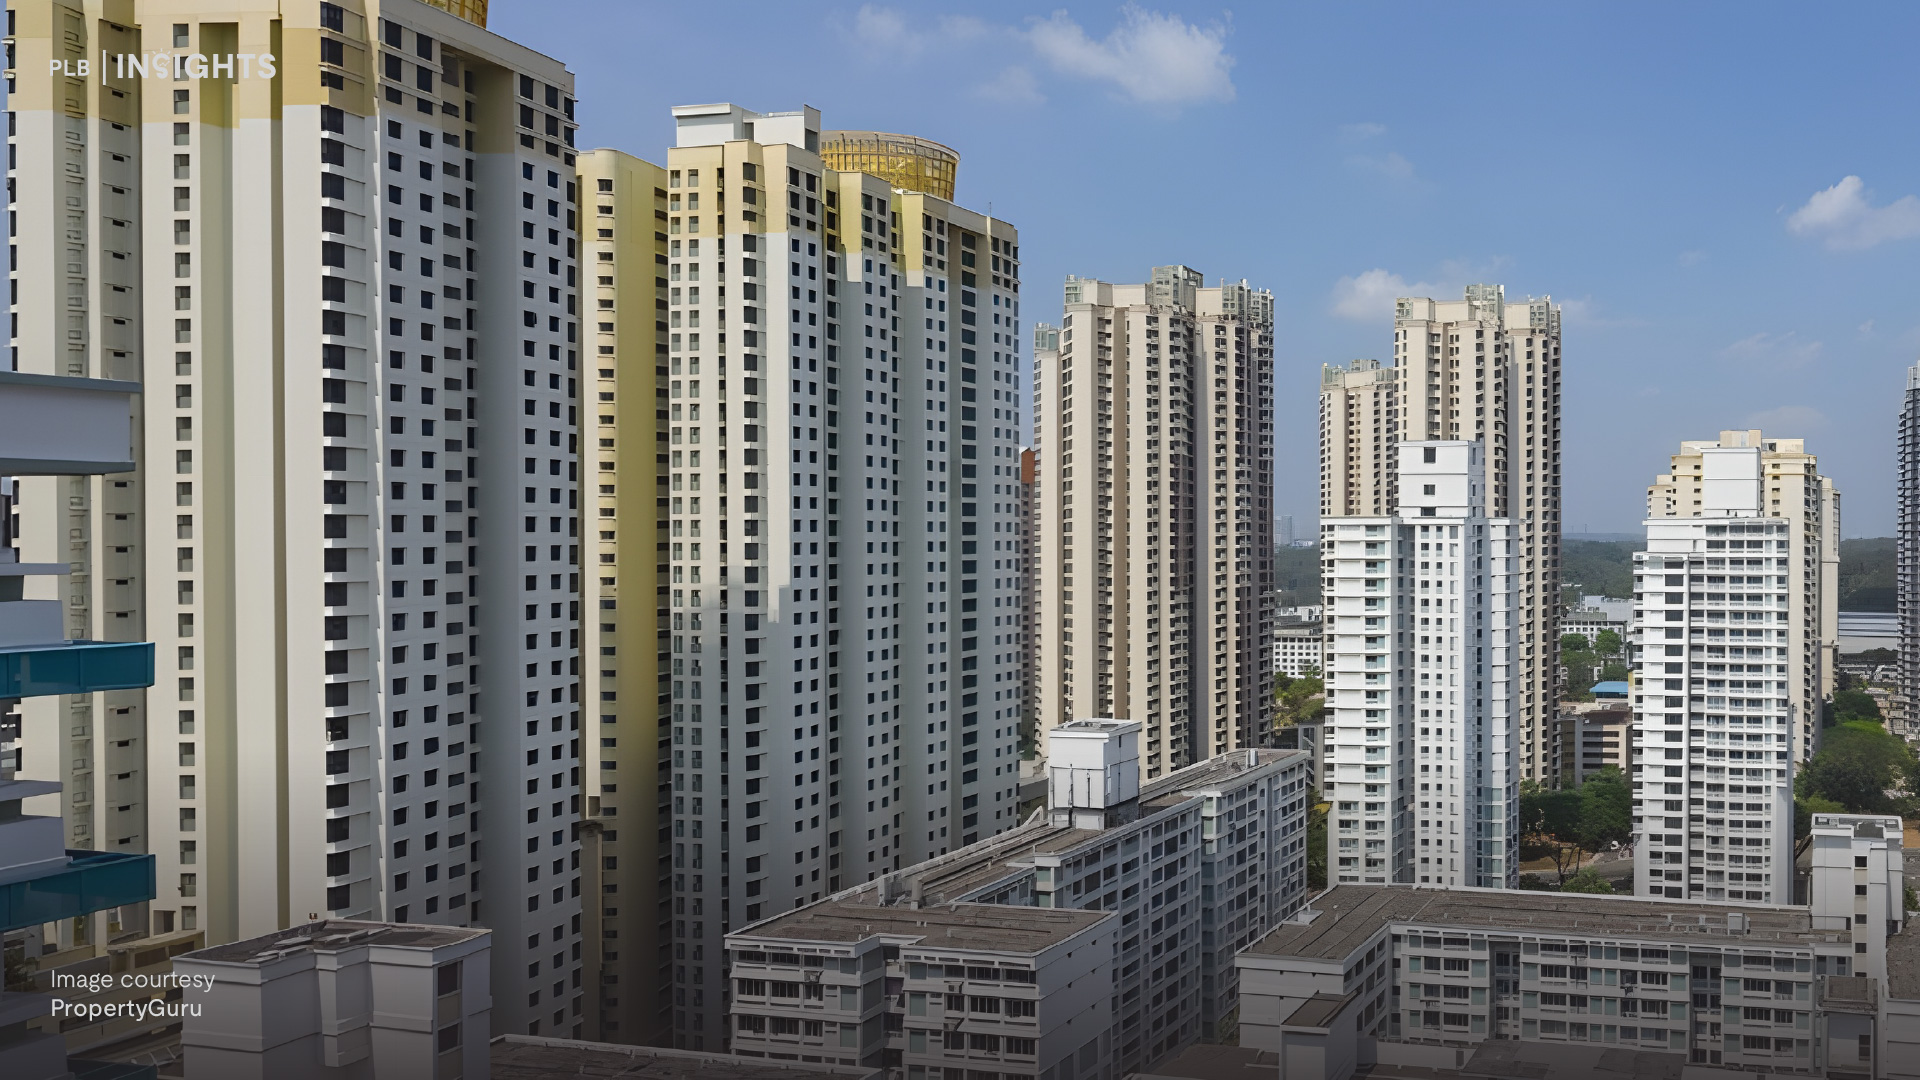
Singapore’s private non-landed property market has been a hot topic in recent months, with conflicting news and opinions from various sources. Some have suggested that the market is in a slump, with falling prices and lower demand for private non-landed properties (condominiums and apartments). Others, however, have painted a slightly less pessimistic picture, pointing to signs of slowing growth and stagnant prices.
Amidst all this noise, this article aims to provide a comprehensive and objective view of the market’s current state. The data used in this article was drawn from URA’s REALIS database on 3 March 2023, and attempts to dispel any misconceptions and provide a more accurate assessment of the market’s performance. We will chiefly focus on the change in PSF and Volume of transactions.
In this article, we will delve into the findings of the article and analyse what they mean for property buyers, sellers, and investors in Singapore. We will examine the key trends and factors driving the market, as well as any challenges or risks that may be on the horizon. Through this analysis, we hope to provide a balanced and informative assessment of the private non-landed property market in Singapore, and help readers make informed decisions about their property investments.
A Deeper Look Behind the Headlines and Data
Market participants are currently rather panicky in the current market. With layoffs becoming more widespread in the tech sector in recent months and the Fed looking to increase interest rates further, buyers and investors are starting to get spooked. Now, more than ever, it is important for market participants to be up to date with accurate and holistic information, giving them a more complete image of the uncertain world we live in now.
A recent Business Times and Straits Times article features the 99.co and SRX flash estimates of this January’s month-on-month performance. An important note for readers is that flash estimates are earlier estimates of the month’s performance without the whole month’s data. As such, readers need to not be misled by headlines when the story has not been completely told.
The NUS SRPI has recently put out a flat performance for the private non-landed residential segment. Readers need to know that the index used by NUS has a base month of March 2009. This base month can affect the calculation of the month-on-month performance of the property market. That is because the changes in monthly PSF are measured as a relative change, with a reference point in March 2009.
In our analysis, we use URA’s REALIS database on the private non-landed transactions from January 2022 to January 2023. We use the data to arrive at the month-on-month and year-on-year performance analysis of both PSF and Volume of transactions. For readers like yourself to have a complete picture of January’s performance, we break down the transactions into new sale, sub sale, resale, and all sales (grand total) transactions. We also slice the data by region, to OCR, RCR, CCR, and All Regions (grand total). All these analyses are on the private non-landed property segment, hereafter referred to as condos. We will focus our analysis on the new sale, resale, and all sale transactions.


Analysis of January 2023 Month-on-Month Performance
When examining how the market is moving, we will need both PSF and Volume data to have a complete view of how markets are moving. Especially when we are looking at how each segment affects the grand total. In the data that we present, you will find how the numbers on aggregate do not tell the full picture.
For new sales in January 2023 (new launch condominium sales from developers), we see that the PSF performance for each region has increased. The PSF of OCR new sales condos have a month-on-month (m-o-m) increase of 6.44%, the PSF of RCR new sales condos have an m-o-m increase of 1.50%. The PSF of CCR new sales condos have an m-o-m increase of 3.89%. Based on these price movements, the PSF of each and every new sale region has actually increased.
Yet, on the all region measure, we have an m-o-m PSF decrease of 4.95%. This decrease is due to the immense increase in volume of OCR new sales transactions (658.33%). Because the absolute PSF for OCR condos is lower and having a higher number of OCR new sale transactions lowers the grand average PSF, thus reflecting a negative number for All Region new sales.

For Resale condos, we see that the OCR experienced an m-o-m PSF decrease of 3.17%. The RCR experienced an m-o-m PSF decrease of 0.15%, the CCR experienced an m-o-m PSF decrease of 0.43%. While each region of the resale market experienced a decrease in PSF on an m-o-m level, the All Region measure for resale had an m-o-m PSF increase of 0.77%. This increase is because of the relatively higher volume of transactions for CCR than OCR and RCR, thus increasing the all region PSF for resale transactions.
This poorer m-o-m performance for the resale segment is not new. Both PSF and Volume fluctuate quite a bit on the monthly level. PSF is even more volatile when the volume of transactions drops to a lower level, which is what the market is currently experiencing. Furthermore, the PSF of the resale condo segment does correct and drop on an m-o-m level in the early and late part of the year, we observe this in 2022 and 2021 as well. Thus, this is not the first time that we have seen property prices drop between months.
When the different types of transactions are aggregated to All Sales, we see an m-o-m increase in PSF across the different regions and the whole island. OCR All Sales had an m-o-m increase of 18.35%, RCR All Sales had an m-o-m increase of 1.66%, CCR All sales had an m-o-m increase of 6.69%. When we look at the grand total, the All Sales for All Region had an m-o-m increase of 11.53%, which is not a number you see on the headlines. The almost unbelievably high increase in the aggregate PSF for condos is due to the higher relative volume of new sales to resale (new sales typically have a higher absolute PSF than resales). This complexity in how the property prices move is why it is easy to get confused by many conflicting voices on where markets are going.

We have briefly discussed the volume performance and how that matters in the aggregated PSF performance. Overall, the volume of transactions for condos had an m-o-m increase of 1.01%. This is mainly due to the large increase in new sale transactions in January (m-o-m increase of 138.61%), especially in the OCR (m-o-m increase of 658.33%). Due to the higher relative prices of new sale to resale condos, we observe a steep m-o-m increase of 11.53% for the condo segment on aggregate.
Readers need to be aware that month-on-month performance measures (be it PSF or Volume) are not exactly the best measure of market trend as the property market has seasonality patterns in how it moves (on a yearly basis and on larger macro levels). Monthly performance should be complemented with an understanding of the larger trends in the market as well as the macroeconomic and regulatory environment.
Analysis of January 2023 Year-on-Year Performance
The year-on-year performance for January 2023 may give a slightly less noisy interpretation of where markets are headed but is still not complete on its own. In this section, we will look at how January 2023 has performed relative to January 2022. On the aggregate level, the condo segment had a year-on-year (y-o-y) PSF increase of 17.32% and a y-o-y volume decrease of 41.13%. While property prices have increased, the volume of transactions has decreased when compared to 2022.
Some market participants have interpreted this slow down in transaction volume as an indication of a market peak and expect further market decline. While this pans out often in equity markets and other asset classes, Singapore’s property market is starkly different, with a highly involved government in regulating supply and demand dynamics.

New sale condo PSF has increased y-o-y by 19.19%, while resale condo PSF have increased y-o-y by 10.3%. On aggregate, there’s a y-o-y PSF increase of 17.32%, which is largely driven by new sale transactions in January 2023. This is despite an overall lower volume performance in January 2023 compared to January 2022.
The volume of transactions has already fallen to a very low level on a historical basis. It is still premature to say if this is the start of a sustained fall in prices or an extended period of low volume. Nonetheless, we expect prices to remain stable at an elevated level until supply issues in the residential markets are sufficiently addressed. As for the low volume of transactions, we expect a strong rebound when interest rates start to get cut, potentially signalling the start of a new cycle.

Noticeably, the number of new sale transactions in the CCR was higher than January 2022 (y-o-y increase of 48.04%). This might be of interest to prospective buyers looking for a CCR new launch condo. The RCR also faced y-o-y decrease in the volume of transactions of 83.7%. Note that the monthly data for new sales is very sensitive to the schedule of new launches across the year.
Even though this is a year-on-year performance, it still isolates the new sales data in the month of January for both 2022 and 2023. Thus, it should not be extrapolated to tell a story about market trends. If done so (as we see very often, ourselves included), the audience would need to exercise some discernment in reading.
Closing Thoughts
To sum up our discussion, buyers, sellers, and investors alike should take headlines and data with a pinch of salt. Real estate data is complex. And how property prices move can be computed in many different ways. The main point we are trying to make is for readers and market participants to be more educated in the way they go about understanding the market. It is not a matter of which opinion or data is right, but rather which gives a bigger picture of what is going on in the market.
Market participants will need to be even more cautious now than in previous quarters. As the market is behaving more volatile, emotions take over our decision making and our understanding of the world. We need to stay well informed to make sure that we do not make rash decisions as the market makes its moves.
If you love to stay ahead of the game, get educated on the cutting edge of Singapore’s real estate scene with our Nuggets On The Go (NOTG) YouTube channel. You can also check out our free webinars to learn more about specific market segments and our strategies on how to approach the market. You can also reach out to us personally if you need advice customised to your personal real estate needs.