Inflation and Interest rates remain high in Singapore. Currently, Singapore’s Annual Inflation Rate stands at 7.5% in September 2022 (YoY CPI-All Items). Interest Rates have hit 3.89% and fixed home loan rates have reached a high of 3.85%. In addition, the combination of these macroeconomic factors have also pushed the introduction of new cooling measures forward to the market at the end of September. Despite these bearish developments for the housing market in Singapore, the end of interest rate hikes is possibly in sight as we approach closer to the US Fed’s Terminal Rate of 4.6% by 2023Q1.
Nonetheless, upward revisions in interest rates are still possible if inflation continues to remain stubbornly high. Singapore continues to perform relatively well in GDP (4.4% YoY, 1.5% QoQ) and Employment (75.6K increase), signalling resilience despite recessionary concerns. The Housing Market in Singapore shows relative strength against its peers in the US and China, which are suffering from severe price correction due to macroeconomic woes.
Landed Properties start to face volatility risks as demand starts to decline. Condominiums & Apartments continue to display geographical disparities which may offer interesting value plays in the market. Executive Condominiums (particularly Resale) are now emerging as an affordable alternative to the private property segments. HDBs continue to serve as the baseline for Housing Prices in Singapore, they have climbed substantially since the pandemic and continue to rise with inflationary trends. This report brings into focus pockets of opportunities in each of these property segments.
Download the report here!
Foreword by Melvin Lim
CEO, Co-founder PropertyLimBrothers (PLB)
Property prices are climbing a wall of worry as we see the end of the third quarter of an increasingly turbulent year. Global geopolitical instability, rising inflation and interest rates have impacted countries around the world. Singapore is no exception. Yet, with such an adverse environment for real estate, Singapore remains steady in the face of even more uncertainties to come in Q4 and beyond.
Despite the piling concerns in the market, speculators are disappointedly waiting for a housing crash that has yet to manifest. We should be careful what we wish for when it comes to a fall in housing prices. The housing market is intricately linked to the financial system, and a rapid fall in housing prices would be one that comes with multiple side effects for the economy.
We consistently preach and practise our philosophy on the housing market in Singapore, which is to never time the market. There have been countless occasions where we have witnessed clients and market participants waiting for lower housing prices which never came, and had to purchase a property that was within their budget but not their ideal choice.
As Singapore’s housing market continues to put out new highs, we are advising our clients to be prudent and focus on their personal needs and what they look for in a home. Rather than focusing on market returns, we hope that buyers and sellers have happiness in their households and with their property decisions more than anything else. After all, behind every home is a family.
2022 Quarter 3 marked a special moment in PLB’s history. We have finally set up our own PLB Realty as of 9 September 2022. Being an independent realty is a big step in our journey to provide our clients with the best-in-class service, research, and technology in Singapore’s real estate industry. Our heartfelt thanks to our family, friends, clients, and fans, for supporting us every step of the way. We look forward to creating ever more insightful, entertaining and exciting videos and editorials for you.
Methodology
This report is based on caveat lodged data provided by URA. We supplement this main source of data with other data providers, such as Squarefoot, Edgeprop, TradingEconomics and Statista. Other third party sources also include corporate reports published by reputable banks and top consulting firms. We also make use of economic data provided by various government websites from Singapore and the United States, including information from Central Banks around the world.
Our report pays attention to key macroeconomic trends in the world. We look at how changing monetary policy and growth outlooks might affect the real estate market in Singapore. Close attention is given to Singapore’s demand and supply factors in the property market. Using both macro and micro conditions to inform our analysis, we share with you our take on how the real estate market will perform in the coming quarters.
Micro analysis is mainly centred upon price and volume movements in the market. We use a non-parametric subsampling approach to find discrepancies between the performance of different segments in the real estate market. We take performance data from URA and proceed with creating subsamples for analysis. The samples are sliced by property type, size, location, and other characteristics. The mode of analysis is mainly descriptive. With some qualitative analysis and comments on consumer sentiment and behaviour.
The Q3 report pays special attention to the high inflation and interest rates and their effect on Singapore’s real estate market. The report also serves to temper the fears of Singaporean consumers. Bringing to mind the light at the end of the tunnel, by focusing on the terminal interest rate and the growth prospects from specific segments that can still prove to be attractive housing and investment options.
Content
Macro
- The Coupled Effects of High Inflation and Interest Rates
- When and Where will Interest Rates Stop?
- Relatively Resilient Economy & Housing Market
Micro
- Landed Properties Facing Volatility Risks
- Condominiums & Apartments with Varying Performance
- Executive Condominiums Emerging as Affordable Alternative
- HDB as the Baseline for Housing Prices
- In Focus — Opportunity Spaces for Q4 and Beyond
The Coupled Effects of High Inflation and Interest Rates
As we come to the end of the third quarter of 2022, data on inflation has not been what central banks are looking for. The silver lining behind inflation data globally is that inflation may be reaching its peak in the economic cycle. Despite this ounce of good news, inflation still remains at stubbornly high levels.
In Singapore, the current All-Items inflation rate stood at 7.5% in September. Whether inflation has reached its peak is still speculatory. As global tensions and uncertainties intensify, we may continue to see a prolonged period of high inflation. This hurts the purchasing power of residents in Singapore and property is no exception as an asset class.

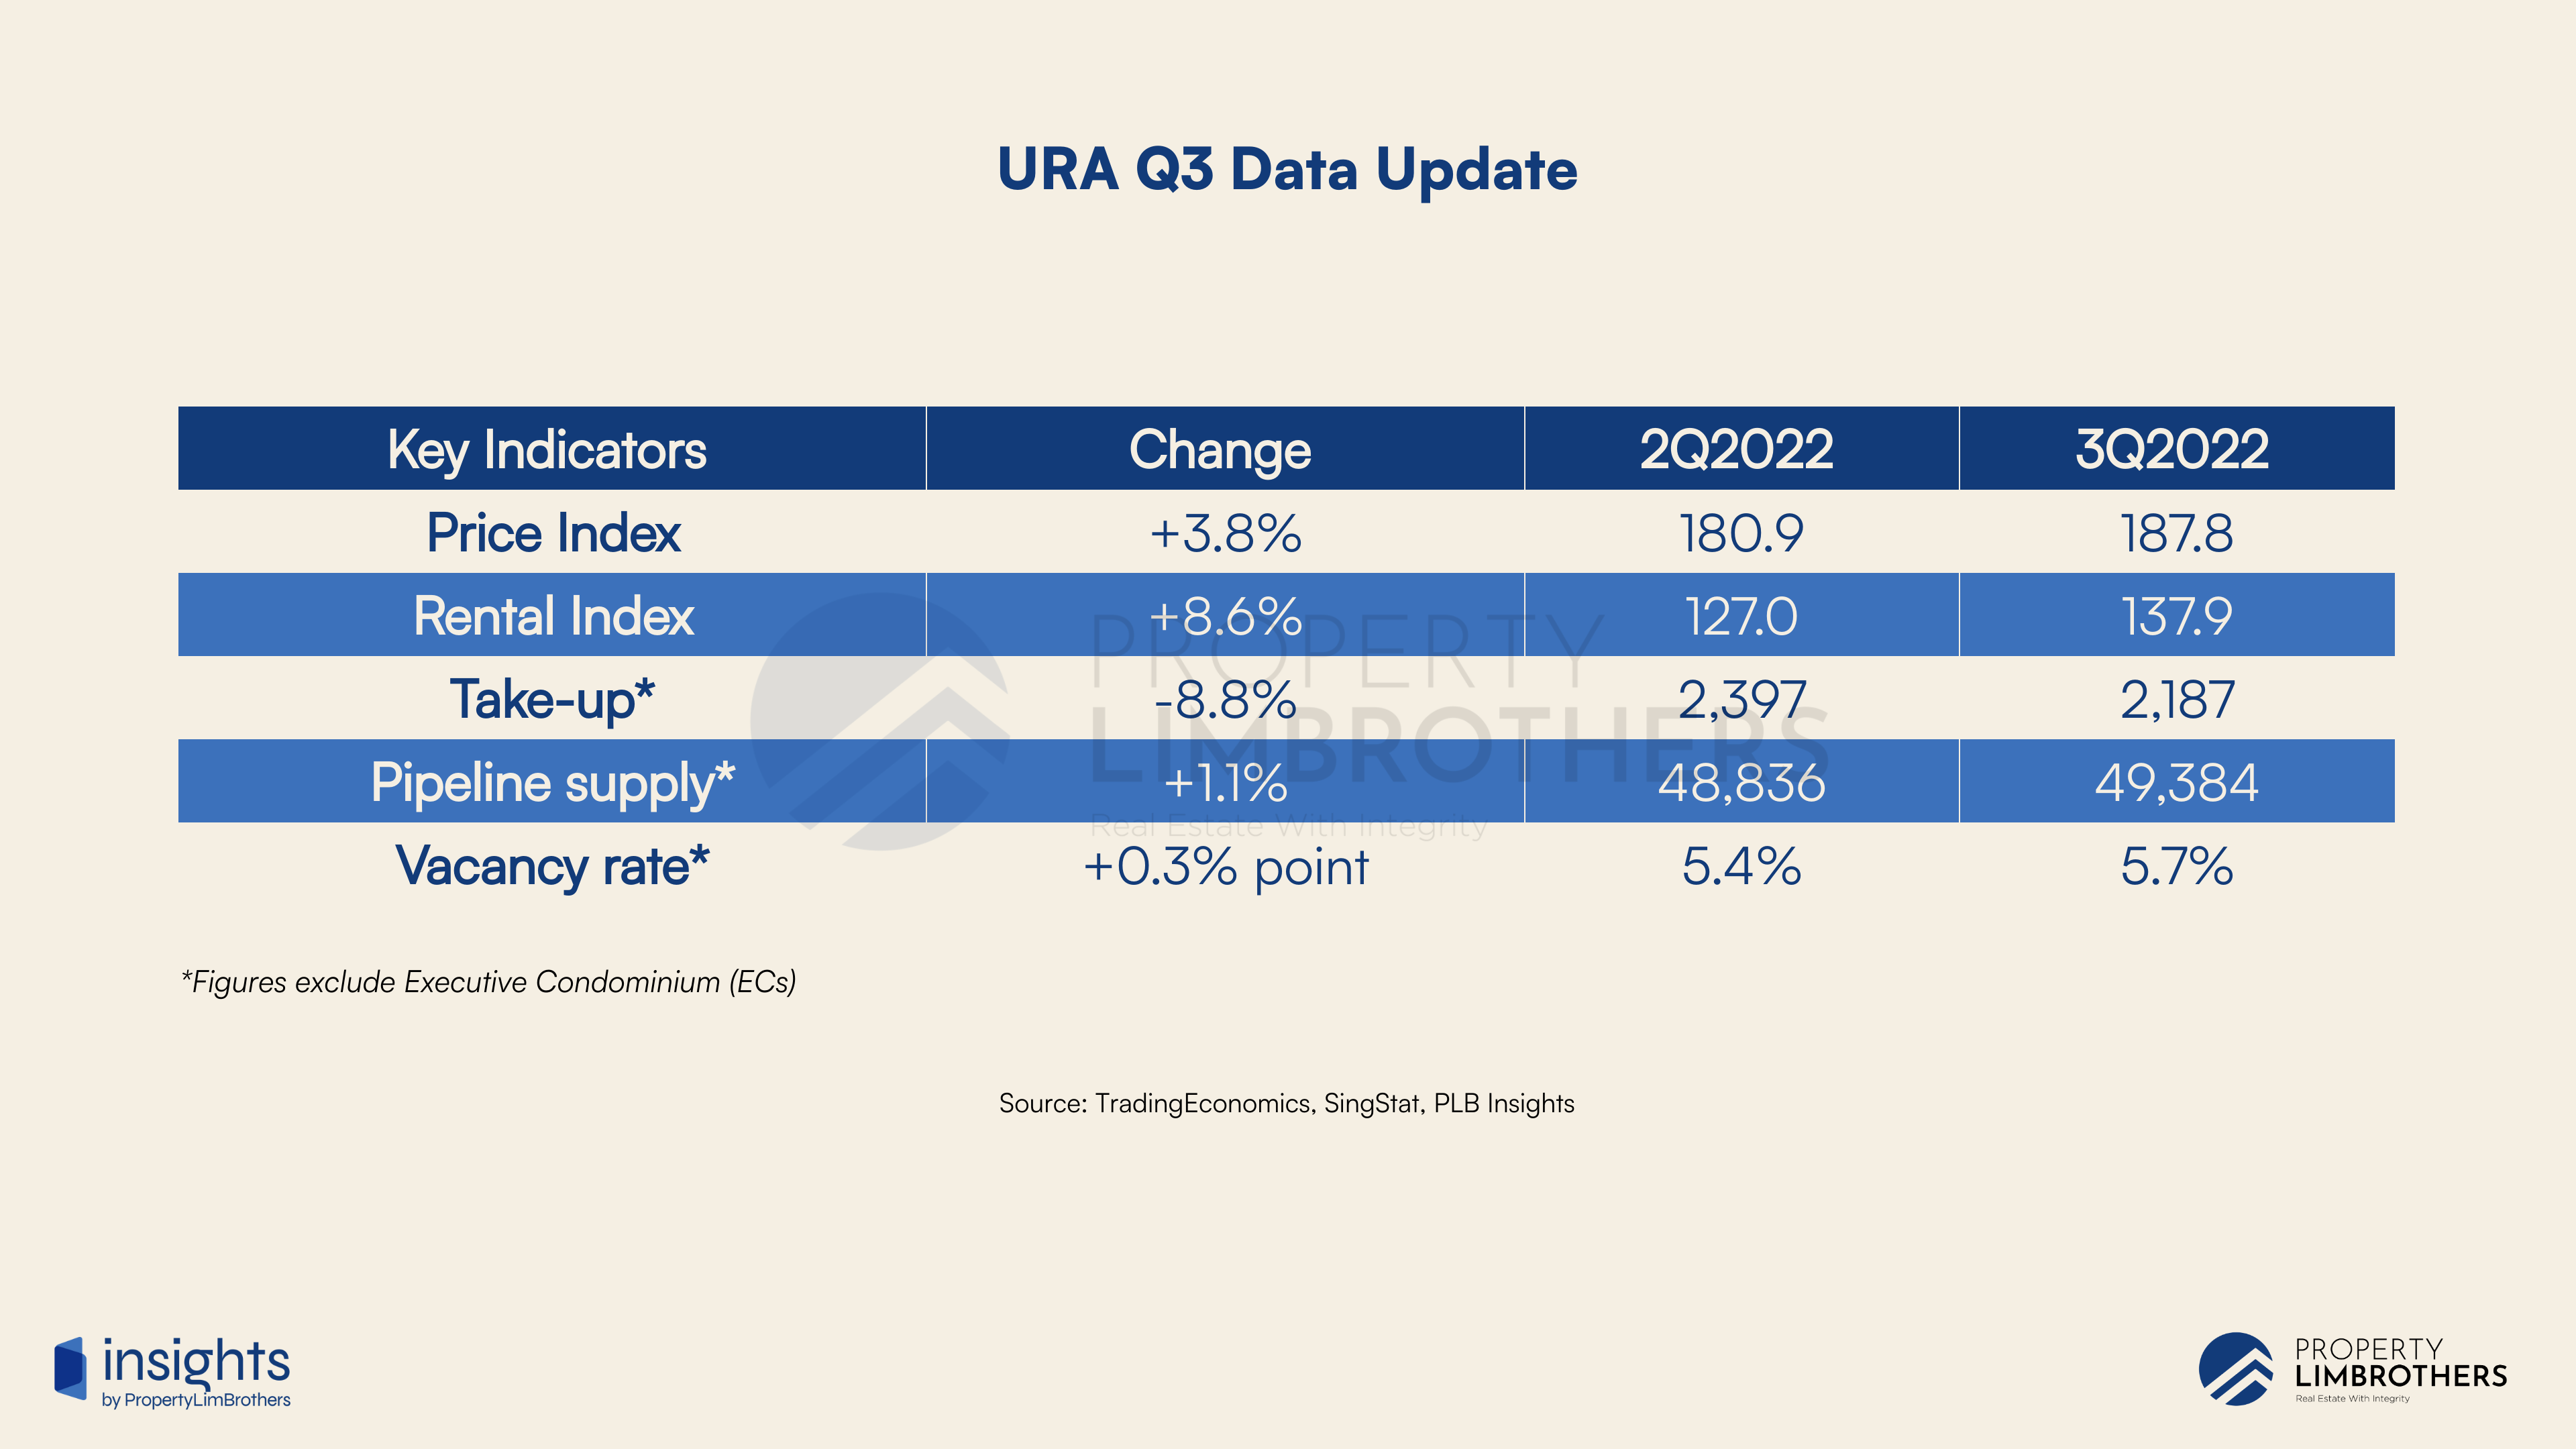
The URA Q3 data release highlights much higher private property prices and rentals, which are reflective of the larger inflationary trends. We see an overall increase in price by 3.8% and increase in rentals by 8.6% on their respective indices. In addition, it is important to note the declining demand at these higher prices based on the lower take-up rate, and increased pipeline supply and vacancy rates. These are signs that more and more buyers are gradually being priced out of both the private property and rental markets.
As a result of the persistently high inflation, the Monetary Authority of Singapore (MAS) has continued with its hawkish monetary tightening policy. This is in line with most central banks in the world, particularly the US Fed. And can help Singapore cope with the rising price of imports as inflation digs in on the global markets. This sees local interest rates rise to as high as 3.89% at the end of the third quarter in Singapore.

With the possibility of persistently high inflation on the table, we see market expectations of high interest rates remain. This has been one of the fastest interest rate hiking cycles in history. Home buyers will feel the impact of rising interest rates if they were previously unable to secure a fixed interest rate loan. Interest rates have risen more than 3% over the past 3 quarters and are expected to rise more in Q4 as more rate hikes have been planned by the US Fed.
When and Where will Interest Rates Stop?
Interest rates are set to peak at 4.6% by 2023 Q1 in the US Market. This is based on the Terminal Interest Rate in the US. While the Federal Bank has set this as the peak interest rate for this cycle, further changes can still be made depending on the inflation outlook in the future. Presently, the possibility of high interest rates remaining at the 4.6% terminal rate for some time is present.

The steep Fed pivot by 2023 Q1, where the US Fed starts to cut interest rates is what the market is currently looking forward to. However, this is not a given fact. The Fed can keep interest rates high if it does not reach its inflation target of 2% by 2023. Market reactions to this persistently hawkish Fed may be bearish.
Persistently high interest rates are also bad news for real estate markets. Presently, the US housing market has fallen month-on-month by 0.8% in July and a further 1.6% decline in August. The high interest rate environment is wreaking havoc in the US housing market. This effect has yet to manifest in Singapore, due to stronger holding power and regulations that prevent the rapid transactions of properties.

The fall in housing prices in the US is more likely due to unaffordable mortgages. United States MBA 30-Yr Mortgage Rate hit a high of 7.16% in October, which was the highest since 2001. Beyond a mortgage rate of 5%, property buyers will start to feel the heat and face a fall in demand, causing a price correction.

The housing market in the US is not as regulated as Singapore’s. Regulators in Singapore are much more involved in the transaction mechanisms and introduce cooling measures actively to put a lid on property prices. This prevents excessive exuberance from developing in Singapore’s property market. Its effects can be seen as Singapore’s Residential Property Price Index diverges from US S&P Case-Shiller Home Price Index from 2010 to 2018.

Thankfully, mortgage rates in Singapore have not reached the 5% threshold. Currently, fixed home loan rates have reached a high of up to 4.5% but still average around 3.5%, close to Singapore’s SORA rate. For speculators looking for a price correction and for home buyers looking for lower prices, a mortgage rate of above 5% may signal some possibility of lower prices. Though, high interest rates will make the purchasing process, interest payments and cash flow concerns more painful for just a price discount in quantum.
Coming back to Interest rates, where and when it will stop rising, we take the Fed’s goal of a terminal rate of 4.6% by 2023. We expect interest rates to stop rising then and peak. While this may change with inflation conditions, we will stick to these numbers at the moment.
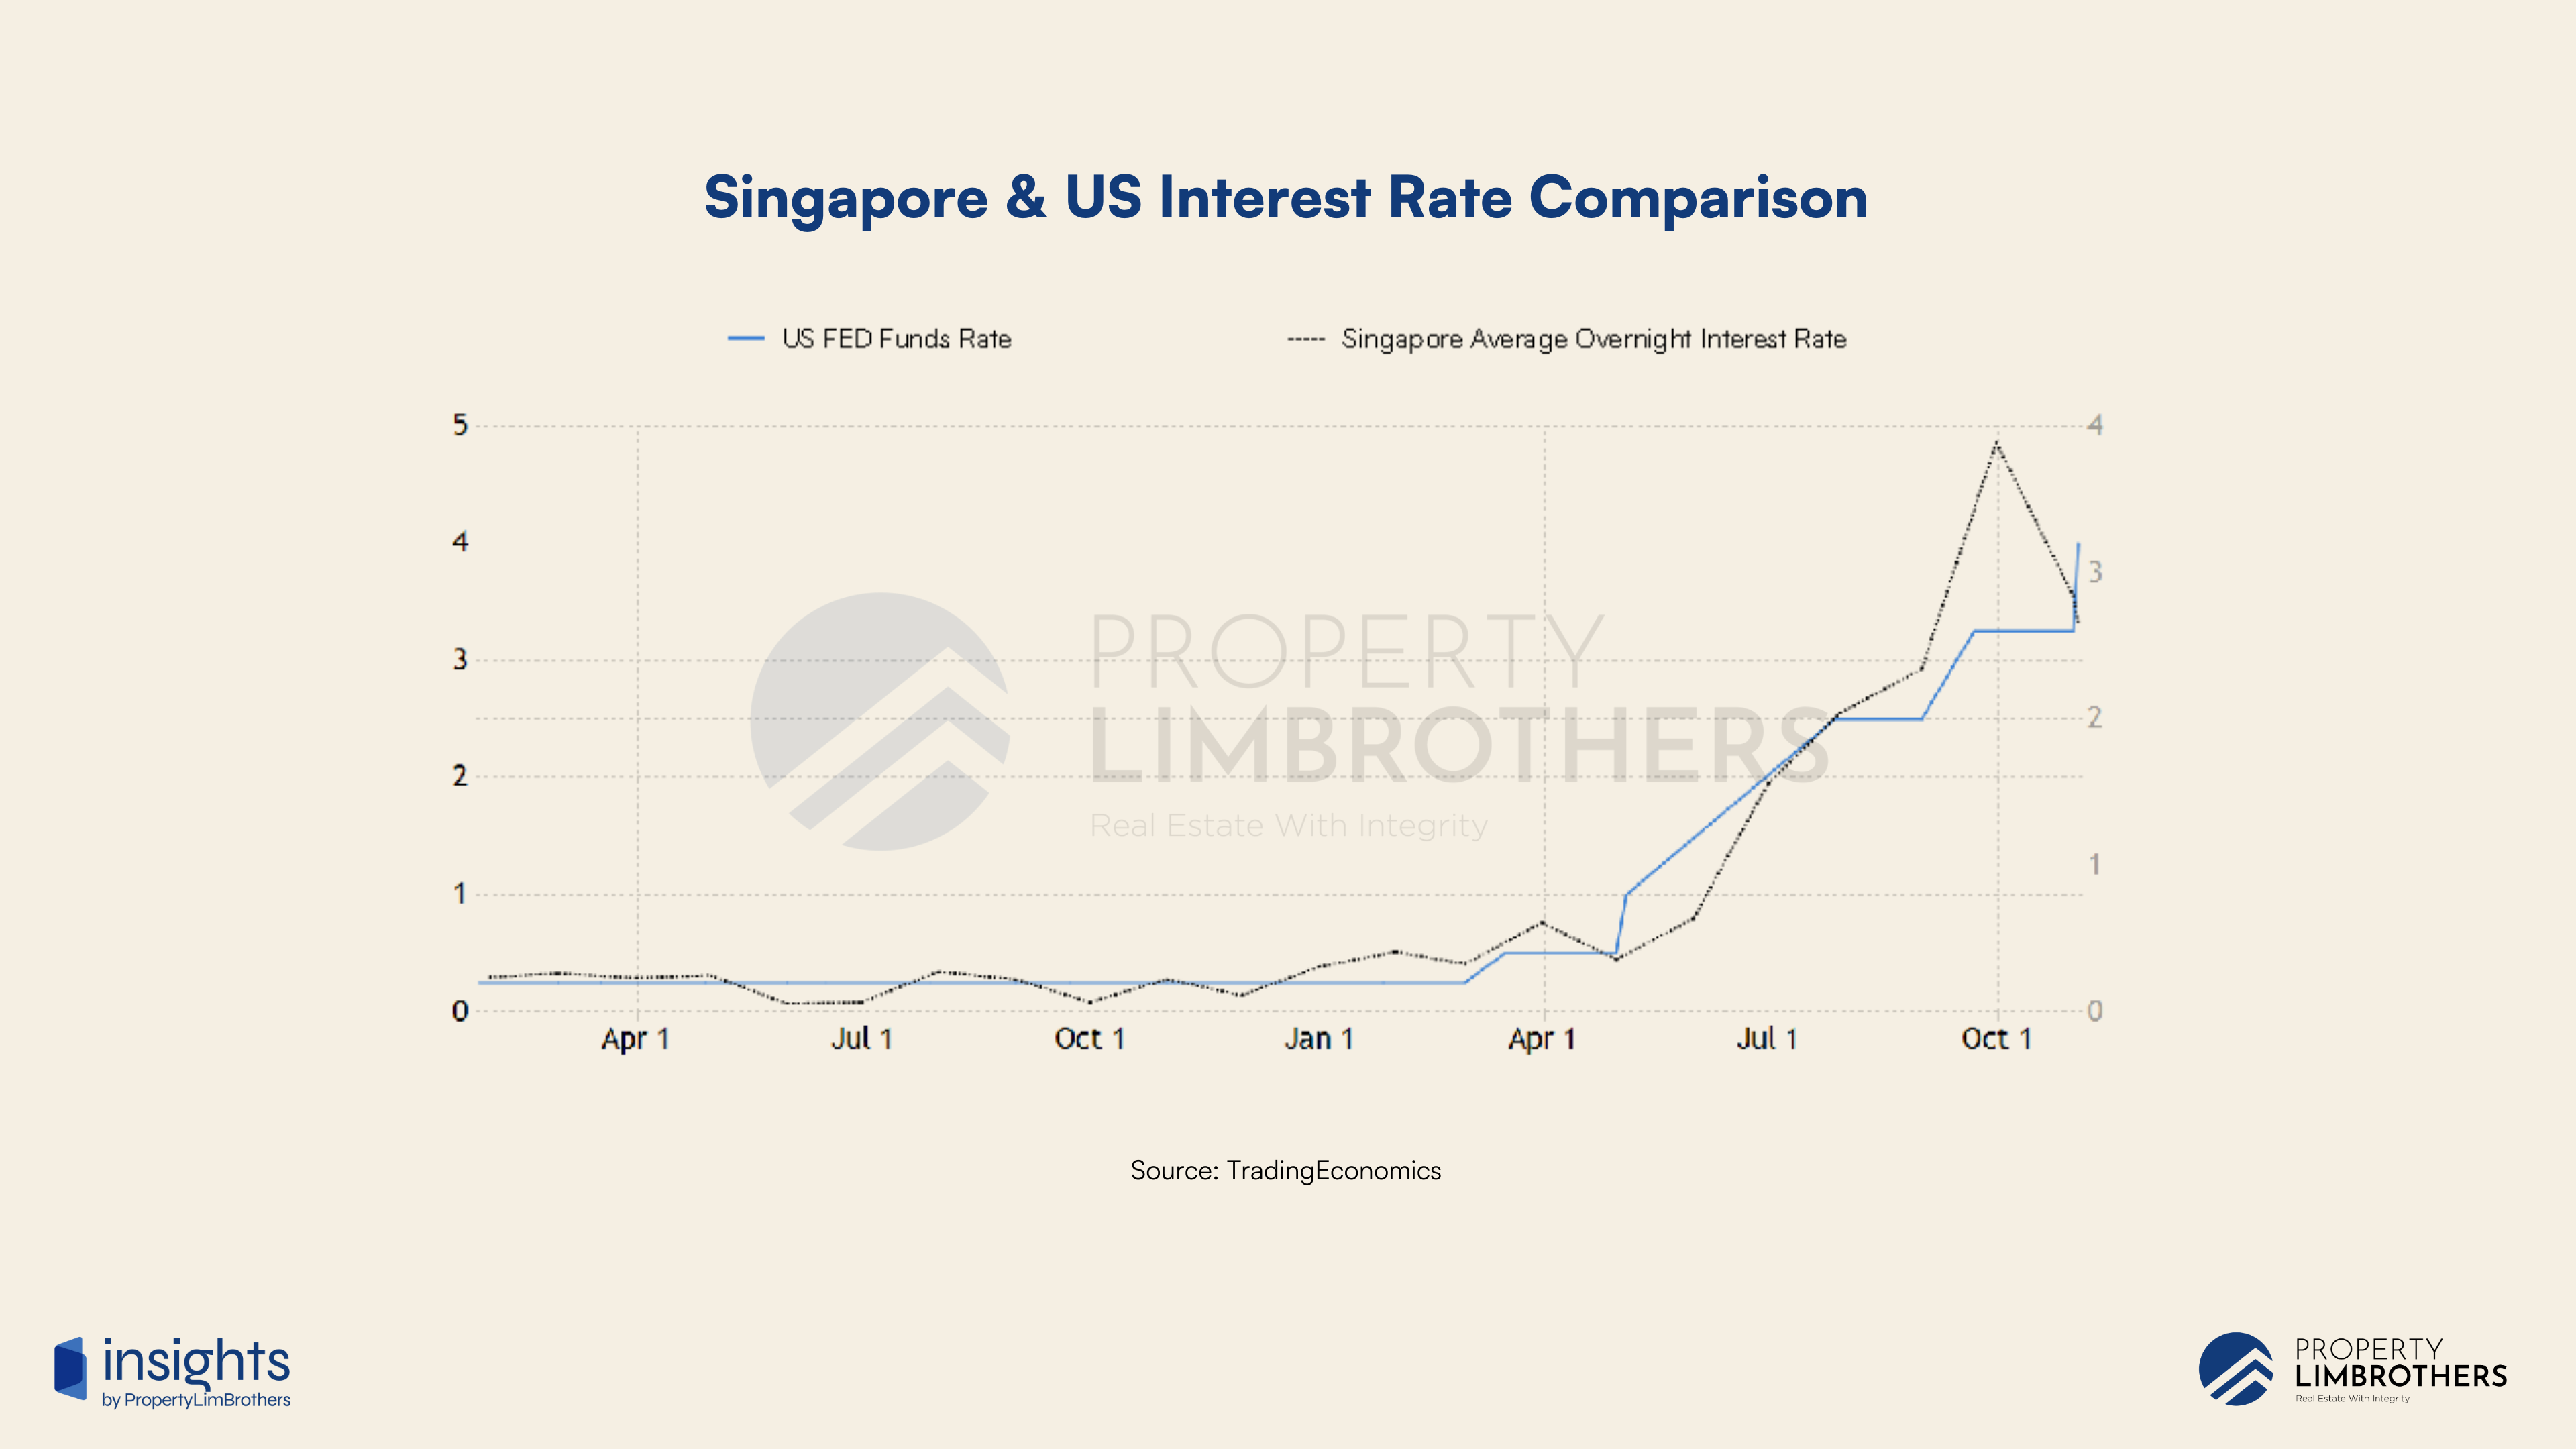
With Singapore’s SORA closely mirroring the US Fed Funds Rate over the course of the year, we expect Singapore’s interest rates to follow closely behind US rate hikes and reach a similar terminal rate around the 4.50% to 4.75% range. While this is considered high interest rates to most, it might not be sufficiently high to trigger a market sell-off in Singapore. Mortgage rates in Singapore going beyond 5% will increase the risk of a market correction to some degree.
Singapore’s Relatively Resilient Economy & Housing Market
Despite global concerns piling on growth and earnings disappointments, Singapore has managed to put out a decent GDP performance in Quarter 3 growing 1.5% (seasonally adjusted quarter-on-quarter) based on advanced estimates. With this solid performance in Quarter 3, Singapore avoided a technical recession and has beat some analysts’ estimates.

This strong GDP performance is coupled with strong employment numbers. Employment change grew by 75,600 persons. While some interpret this as slowing job growth (compared to Q1 to Q2 growth) due to the increased reports of retrenchment exercises, the overall Singapore economy remains strong in GDP and employment growth.

Home Prices have remained resilient, climbing for 11 consecutive quarters since 2020. On aggregate, the housing market in Singapore still commands high prices, allowing it to benefit from inflationary pressures yet have not faced the price effects of high interest rates.

With Singapore avoiding a technical recession and a drawdown in housing prices, immediate concerns of a recession are abated. This is not to say that recession risks are completely off the table. As the world continues to be increasingly volatile in the geopolitical and economic sense, Singapore would need to maintain its vigilance in its economic and housing policies.
Overall Macro Situation
The Macro Situation in Singapore is relatively better as compared to other countries such as the US and China. This refers specifically to the housing markets and their relation to macroeconomic factors such as inflation, interest rates, GDP growth, and employment.
With the recent introduction of additional cooling measures at the end of Q3, market participants might start looking for price corrections or a deceleration in price increases. Against conventional intuition, these cooling measures might actually prevent a steep fall in prices but also reduce the chance of a rapid climb in prices. Ultimately, cooling measures lower volatility in the market, this includes both upside and downside movements in price.
The technical reason for this observation is that holding power of the market is increased when only buyers who can afford the properties after tighter regulations are allowed to participate in the market. This prevents weak hands from entering the market and subsequently letting go of properties at a loss due to the rising interest rates and unaffordable mortgages. The result of persistent inflation, interest rates, and cooling measures in this current market condition might yield an interesting result in Singapore’s real estate market.
The macro situation suggests that property prices and rentals might remain elevated, with fewer market participants as prices continue to climb in the market. The market could face an increase in a price correction risk only when mortgage rates start climbing beyond 5%. During which, government intervention may be introduced to prop up the property market.
Landed Properties Facing Volatility Risks
As suggested in our previous Q2 report, the Landed property segment might give us clues of aggregate market movement to the downside as a lead indicator of a decline. At the present moment, we do not see a clear downside risk for the aggregate property market. Across all property types, we expect to see a clear geographical dispersion in performance.
For New sale transactions in the Landed segment (Detached, Semi-Detached, Terrace), we see a rise in aggregate price from $1,677 to $1,885 psf. This is a 12.37% increase in price. However, we see a fall in volume from 26 transactions in 2022Q2 to 17 in Q3, contracting by 34%.
Geographically, New Landed property prices have not declined across different districts. This is expected for this category of transactions due to cost-push inflation which raises the prices of new developments in the market. There are two important districts for New Sale Landed properties. First, District 10 has shown the steepest increase in price from $3,079 to $3,676 psf. This is a 19% increase in prices. As the most expensive and highest growth district for new sale in Q3, we would caution buyers looking at new Landed properties in this district.
On the flipside, we see that District 27, an Outside Central Region (OCR) district, has also enjoyed decent growth in Quarter 3 for new sale Landed. Prices increase from an average of $1,452 to $1,771 psf. This represents a 21.9% increase. As more market participants get priced out of Rest of Central Region (RCR) and Core Central Region (CCR) Landed properties, we might continue to see growth in OCR districts across different property types.


In the Resale Landed segment, we see much more variation in price changes due to demand mechanics coming into the picture more strongly. Overall, prices have increased while volume has marginally declined. The average prices rose from $1,538 to $1,617 psf. This represents a 5.16% increase in price. However, volume fell from 526 to 457 transactions, contracting by 13.1%.
As mentioned in the title of this section, the Landed segment faces volatility risks moving into Q4 and beyond. This is fundamentally due to the contraction in volume of transactions. With a lower number of transactions in an already small market, different properties being transacted can cause the price movements on the market to swing (due to small sample size). This swing in prices, however, is not representative of the entire Landed segment and should not be taken by either buyers or sellers too seriously when the number of transactions is too low.


For the Resale Landed segment, the top growth districts to pay attention to are District 10, 12, and 25. District 10 has average prices growing from $1,792 in Q2 to $2,129 psf in Q3, a rise of 18.8%. District 12 has average prices growing from $1,969 to $2,324 psf, a rise of 18%. These districts close to the city centre saw an increase in demand and enjoyed decent price appreciation.
District 25 in the OCR still puts out a great deal of growth. With average prices rising from $934 to $1,157 psf, a rise of 23.8%. More importantly, District 25 had the lowest average psf being transacted in Q2 for this category. Consistent with the Quantum Effect and Spillover Demand theories, we see that the relatively more affordable categories in the OCR have decent performance.
The bottom districts to pay attention to are District 18, 21, 5. District 18’s average prices fell from $1,244 to $998 psf, falling by 19.7%. District 21’s average prices fell from $1,639 to $1,430 psf, falling by 12.7%. Next, we have District 5, which had its average prices fall from $1,714 to $1,607 psf, a fall of 6.2%. With District 18’s average prices falling below $1,000, it is a district to watch closely over the next few months as it falls into the attractive psf range for this property type. The development of Paya Lebar Airbase (PLAB) with new residential and commercial developments will look to potentially increase the value of District 18 Landed properties in the future. Volatility in this segment may present opportunities.


Looking at the price gaps between Landed properties across regions, we observe a clear CCR-RCR price inversion. This means that RCR Landed properties for New Sale and Resale are currently higher than CCR Landed properties on aggregate. This is an indication of a price imbalance but may be driven by the lack of sellers of CCR Landed properties. This means that Landed property buyers have lesser options in the CCR and are pushed to the RCR to look for their desired properties.
However, if we take on a historical perspective, this CCR-RCR price inversion is not the norm, and we typically see prices go back to equilibrium. CCR Landed prices will likely overtake RCR Landed prices in the long term. These price imbalances may help you make a more informed decision if you are looking for a Landed property in the RCR or CCR regions.

Condominiums & Apartments with Varying Performance
The performance of Condominiums & Apartments (referred to as Condos in general) are expected to vary considerably. In particular, we are looking at the price discrepancy between new launch condos and resale condos. The disparity gap between these two categories is pushing resale prices upwards and favours resale options as the value plays due to its relative affordability.
New launch prices have held its ground, with only a marginal increase of 0.94% in Q3 over the past quarter. The average price increased from $2,321 to $2,342 psf. This is accompanied by a marginal decrease in volume as well. The number of transactions fell from 2,363 in Q2 to 2,163 in Q3. This is a volume contraction of 8.4%.


There are some interesting price imbalances in certain districts. Here, the decline in average price might refer to new launches selling at a discount to the previous prices on the developer’s end. We notice that District 12, 13, 28, 23, and 5 experienced this price imbalance. This could be due to faltering demand or that developers are unable to sell the last few units of the property. District 12, in particular, had its average psf fall from $2,098 to $1,922 psf. This is a 8.3% drop. A small discount at these price levels could be all it takes to run a profit when selling the units at a later date. Depending on the unit, the transaction may take longer to sell if it has less desirable features.
District 20, 6, 15 performed exceptionally well in this new sale segment. District 20 covers the Ang Mo Kio, Bishan, Thomson areas. To no surprise, this is a highly desirable area for residents. Many schooling options including the proximity to the city centre are some of the common reasons why people adore this location. Average prices in District 20 increased from $1,807 to $2,109 psf, this was an increase of 16.7%.

When looking at the price disparities among new sale Condos, we notice a huge uptick in both CCR and OCR prices. This may be due to the erratic nature of launch timings in those areas. However, the new launch market performance has risen tremendously relative to the resale market due to rising land and construction costs. The cost-push inflation is driving a wedge between resale prices and the prices of new launches. If the gap closes, it would likely be driven by an upward trend in the resale market as demand spills over into the Resale Condo segment.


Overall, the resale condo segment experienced an 3.29% increase in prices from $1,506 to $1,555 psf. However, the volume of transactions has contracted from 3,502 to 2,921 transactions. This is a 16.5% contraction in volume. Multiple districts faced price declines. The notable ones being Districts 1 and 2. District 1 has fallen from $2,131 to $1,998 psf in Q3 (6.4% decline). District 2 has fallen from $2,211 to $2,035 psf (7.9% decline).
As noted in our Q2 report, the CCR resale condo segment is starting to face a price correction. Some areas still stand out such as districts 6 and 9, with the largest psf increases, but these are the luxury condos with possibly a small volume of transactions. Otherwise, the OCR has performed well at the aggregate level with only District 25 having a marginally lower psf transacted in Q3. Compared to the RCR which has some inconsistencies in its performance in Q3.

When we observe the price disparity between the different regions, we notice a steep upward trend for all regions. Yet when we look at the gaps closely, the price disparities between all regions are gradually closing, with the OCR Resale category climbing up to catch up with the RCR and CCR regions. This observation is consistent with the thesis we put out in our Q2 report.
As the market gets increasingly more expensive, a large number of market participants are priced out of more central properties. OCR resale properties become increasingly more attractive from a Quantum and Value perspective. With this, prices in OCR Resale Condos will steadily increase to close the disparity gap. We expect to see this disparity gap gradually close as prices across the board continue to rise, with OCR in the lead when it comes to growth numbers.
Executive Condominiums Emerging as Affordable Alternative
As we cover the disparity gap in the Condo segment which favours the OCR Resale condos in terms of growth and demand in the coming few quarters, we can interpret ECs to fall within the same category. ECs are typically located in the OCR. They also present a more affordable entry point into the private condominium market.
In addition, the subsidised nature of new launch ECs makes it more attractive to market participants who are new to the private condominium market. This presents an option to benefit from a pricey market by entering via a more affordable property type. An important caveat in this section of the report is that the sample size for all types of transactions for ECs is limited. As such, the numbers may appear to be volatile. EC launches are also much fewer than Condos and so are more erratic by nature.


When we look at the new sales for ECs, performance has been mixed. Average prices were $1,292 in Q2 and $1,275 in Q3. We expect EC prices to maintain its lower prices to live up to its name as subsidised housing. District 28 (Yio Chu Kang, Seletar) and 19 (Punggol, Sengkang, Hougang) put out higher prices when it comes to EC new sales.


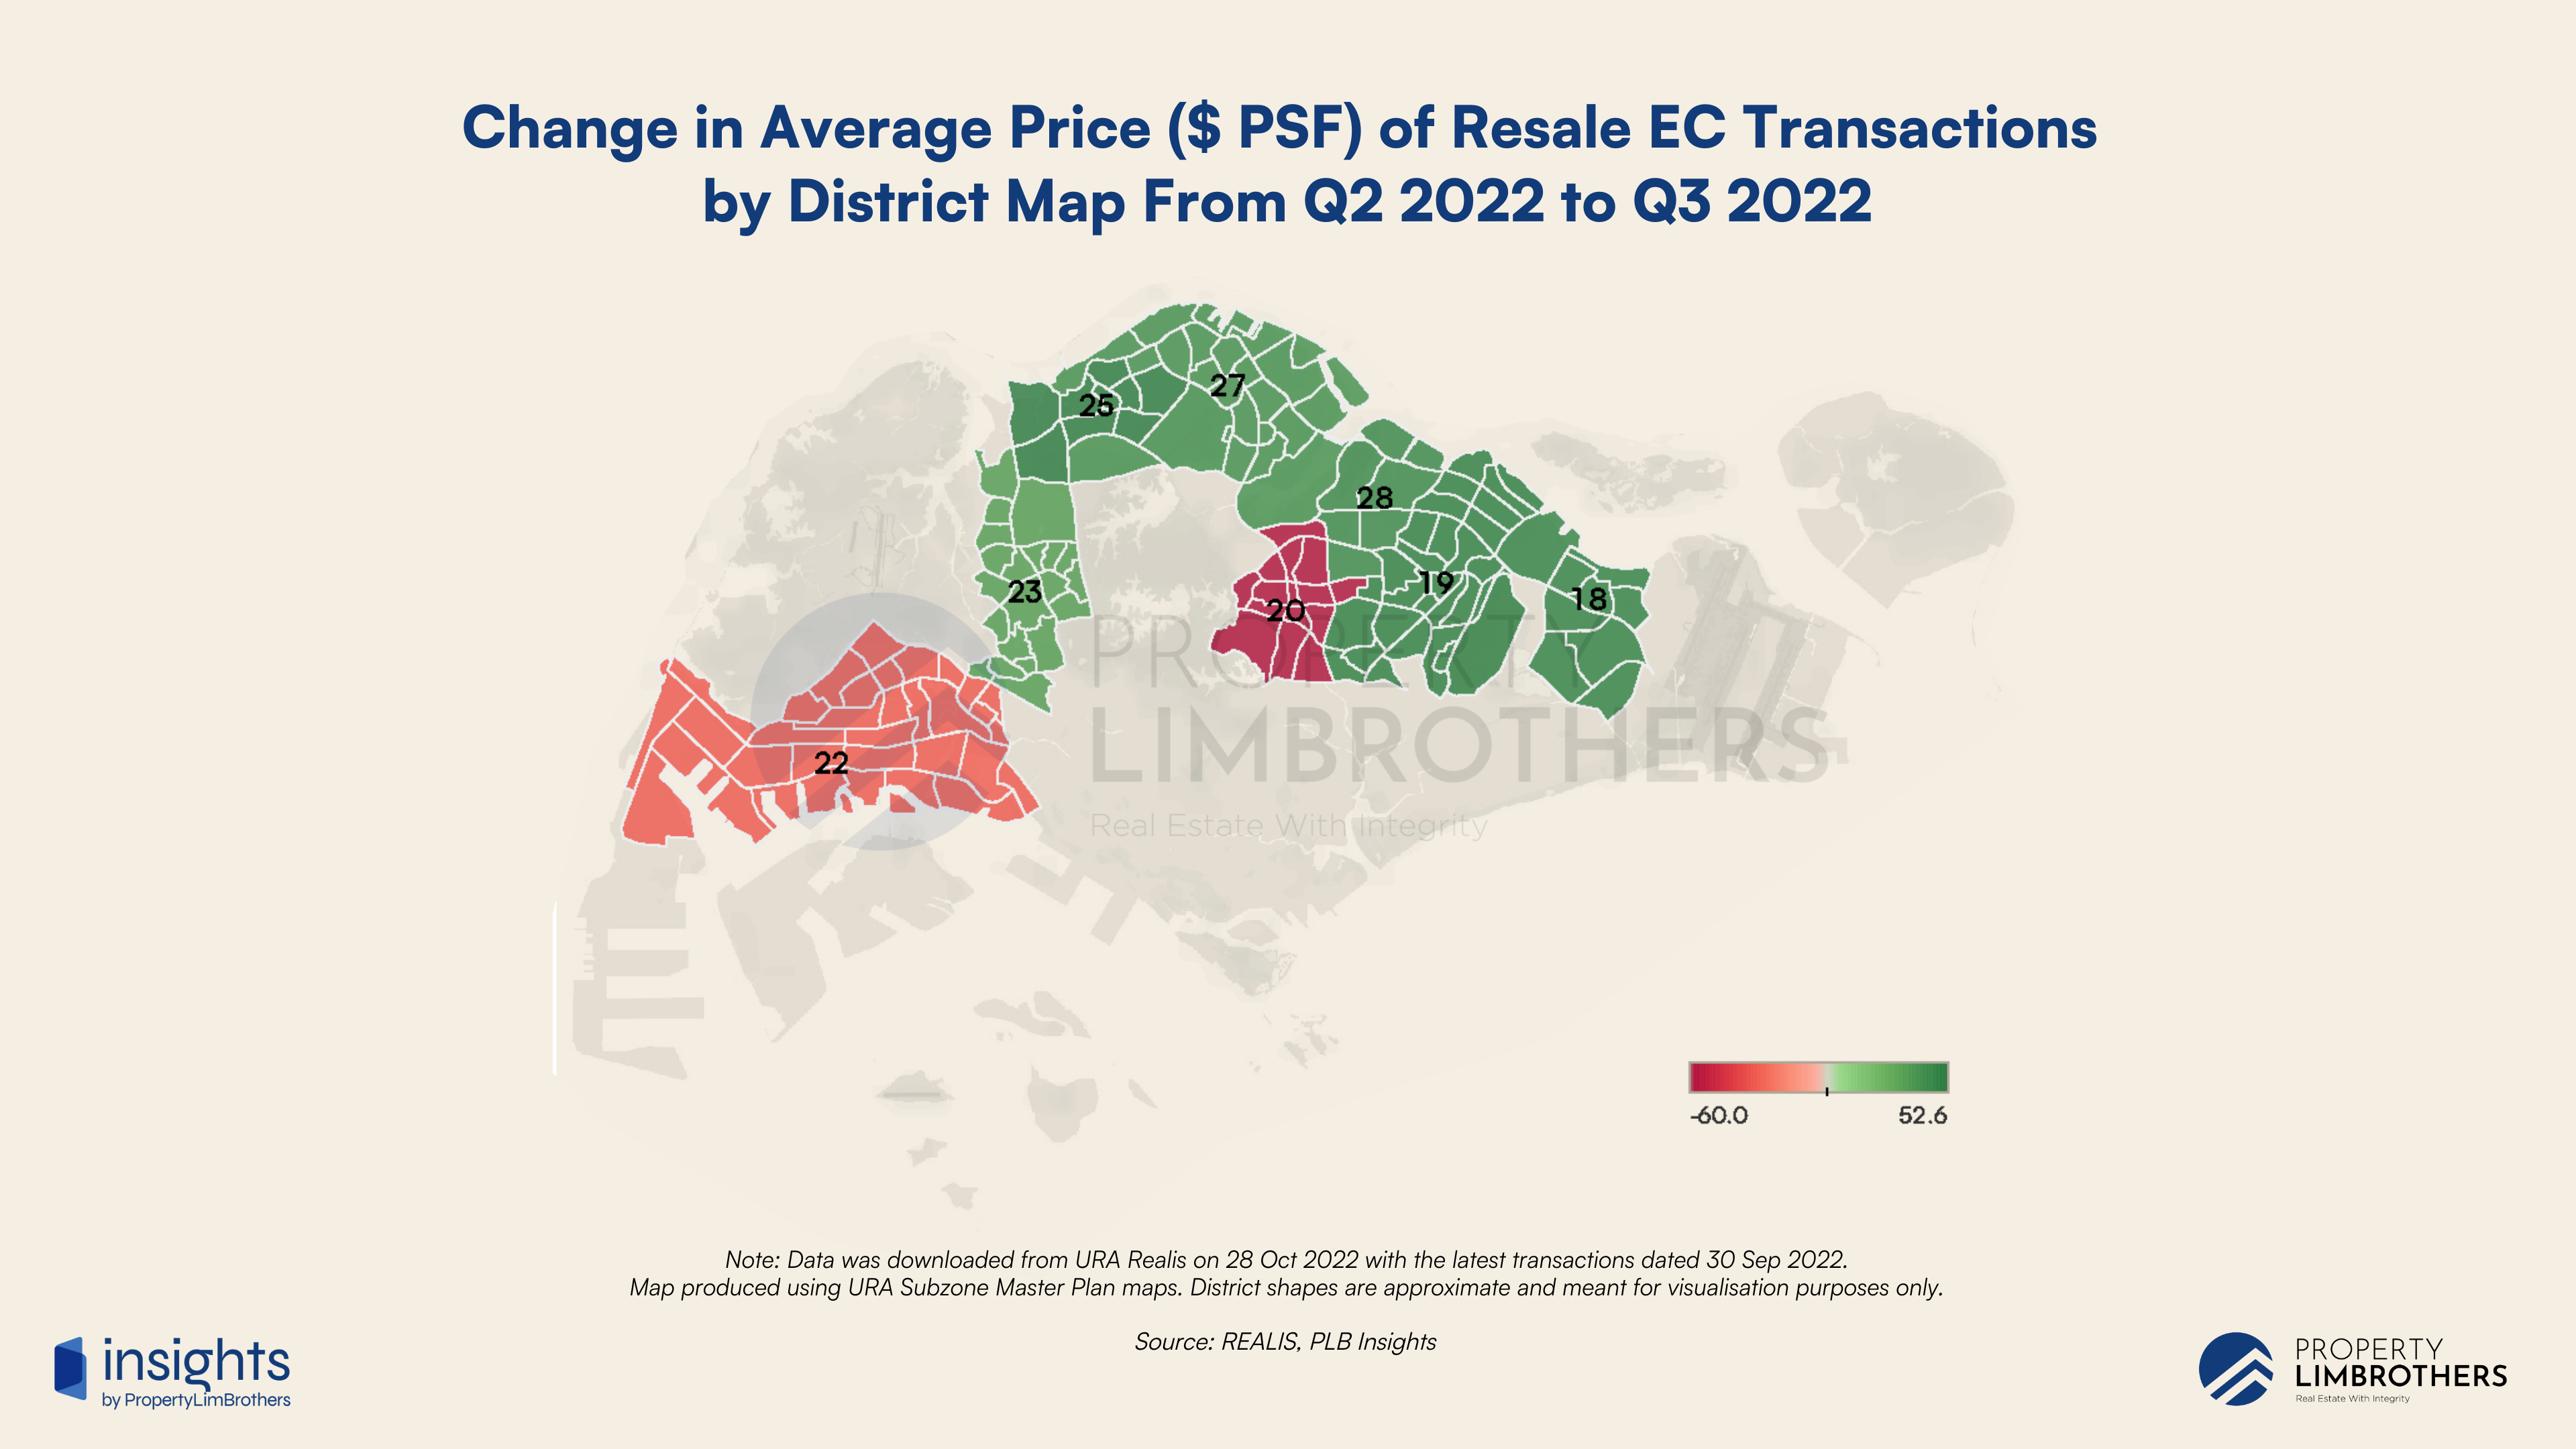
When we compare this to the resale numbers, we see interesting results. Overall, the intuition suggests that ECs should provide profitable transactions and rising resale prices due to spillover demand. On aggregate, EC prices increased from $1,092 to $1,124 psf, a 3% increase. Volume of transactions contracted from 604 to 500 transactions, a 17.7% dip. However, the performance of ECs were not equally distributed across Singapore. While most Districts are showing decent psf growth, District 20 (Bishan, Ang Mo Kio, Thomson) and District 22 (Jurong, Lakeside) are showing a minor dip in prices.
This minor dip may just be a form of price consolidation before moving higher up. Alternatively, they may be a signal of market preference for other housing options within the same districts (such as Condominiums). This particular result is interesting and worthy of further research. Nonetheless, we expect resale EC prices to rise at the aggregate levels over the next few quarters.
Resale HDBs as the Baseline for Housing Prices
For the final segment, we will examine Resale HDBs as an important market segment that acts as a baseline for housing prices. Compared to all other market segments, we observe a surge in Q3 volume for Resale HDBs. This is partial evidence for the fact that a sizable portion of market participants are priced out of the private property market. As a result, demand spills over into the Resale HDB market, putting an upward pressure on prices.
This upward price trend has been in place for 9 consecutive quarters ever since the start of the pandemic. With the market getting pricier, the Resale HDB market looks to provide the most affordable option for market participants who do require move-in condition housing. This upward pressure on prices will intensify as private property prices increase. In part, this is one of the reasons for the recent cooling measure put in place by the government. Private property owners (PPO) selling their properties now face a 15-month waiting period (when there was none last time) prior to being able to purchase a resale HDB.


Aggregate prices for Resale HDBs rose from $529 to $538 psf, a modest increase of 1.7%. The volume of transactions increased from 6,552 to 7,264 transactions, a 10.8% increase from the previous quarter. We expect prices for this segment to continue its upward trend but the volume of transactions may marginally decline due to the new cooling measures which prevents PPO entry into this market segment.
Not all districts look favourable for Resale HDBs though. For Districts 1, 5, 14, and 20, we see a decline in psf prices. This may be due to lease decay of older HDBs found in more central districts. Or it could be that HDBs in that district are already priced much higher than the segment’s aggregate price, causing a mild correction. We expect District 20 to fall into the latter category (small decline of 2.2%). Regardless, this segment is relatively stable. Prices are less volatile than other segments.
With the new cooling measures in place, we expect a deceleration in price increases in the relatively more expensive resale HDBs. This refers to all HDBs in the RCR and CCR region. Two interesting districts to watch would be District 20 (Ang Mo Kio, Bishan) and District 12 (Toa Payoh). District 12 in particular had a 8.3% increase in Q3 over the previous quarter, signalling that some HDB owners may have been taking profits in this exceptional market.
As property prices in Singapore continue to inflate, we will be paying close attention to government intervention in the public and private property segments. In particular, added GLS or land supply given for residential purposes will have a huge impact on housing prices in the medium term (3-5 years). In the meantime, we will be monitoring the Resale HDB segment as it is an important form of baseline prices in the Singapore real estate market.
In Focus — Opportunity Spaces for Q4 and Beyond
This final section of the report highlights opportunity spaces to keep our eyes on as global macroeconomic conditions continue to unfold. In the Q3 report, we highlight opportunities in every property segment so that our readers across different backgrounds can benefit from the insights generated. We will explore more of these opportunity spaces in the coming months in our editorial pieces.
In the Landed segment, New Landed properties in District 27 look to be an interesting space as an entry zone into the Landed segment for market participants upgrading from the Condo segment. In addition, Resale Landed in District 25 and 18 look to provide possible growth opportunities in the medium to long term.
In the broad condominium segment, OCR Resale Condos look to be the core opportunity space as it puts out an extremely consistent growth performance across most districts. This remains the same opportunity space as we had put forth in our previous Q2 report. In addition to this opportunity space, we introduce Resale ECs in North and Northeast Regions as the stronger EC candidates on the market based on the growth distributions by geography.
In the HDB segment, we expect OCR HDBs to have the most consistent growth rates over the coming months. In addition, District 20 and 12 Resale HDBs will be interesting opportunity spaces to watch the after-effects of the cooling measures. These two districts may present good opportunities should there be any price corrections in the coming months.
With these opportunity spaces in mind, we look forward to bringing you more relevant and insightful research in our editorial before the Q4 report. Thank you for your support for PLB Realty.
Caveats & Disclaimers
The insights generated from our report are reliant on the data providers we have used in the process of producing this report. The accuracy of this report is reliant on the data integrity of the relevant data providers.
Any information found in this report does not constitute financial or real estate advice. Please do your own due diligence before making any financial commitments to any related investments or property decisions. Consult the relevant professionals to make sure that you have a proper understanding of your financial situation and that the decisions made are to your own personal best interests.
If you wish to get in touch with our real estate experts, you may contact us here. We are more than happy to discuss the contents of this report in-depth, and how it relates to your personal property journey.