Do Condos without 1 Bedders perform better than Condos with that include 1 Bedders in the mix? This was the original question that motivated this article. At the end of the day, do family friendly unit sizes see more capital appreciation than smaller rental friendly units? This is an important question. Not just for homebuyers and investors, but also for developers. In some projects around Singapore, developers have chosen not to include 1-Bedroom sized apartments in their unit mix. Are these decisions motivated by data, or are they made on the whims of brand positioning?
The myth is that 1-Bedder apartments are pulling down the average performance of new condominiums. So much so that developers sometimes choose to only have larger sized units in their projects. To study this question further, we look at the breakdown of performance by bedroom size across private condominiums.
In this article, we will explore the performance of 1 Bedders across the whole condo population. Using data-backed analysis, we find out if there is a difference in capital appreciation or rental performance between the different bedroom apartments. The working hypothesis is that 1 Bedders perform poorer in capital appreciation but perform better in rental than larger sized units.
Capital Appreciation & Inflation Trend for 1-Bedders
Before we dive into the analysis, we label units less than 500 sqft as “1-Bedders”, 500-750 sqft as “2-Bedders”, and compare them with the aggregate performance of larger units. The caveats lodged data does not include information on the number of bedrooms in the unit that was transacted. So, we will have to make some general assumptions before we move on to the analysis.
In this first section, we compare the inflation of 1-bedder new launches, and the capital appreciation of resale 1-bedders. We look at the breakdown by tenure and also compare this to units of a larger size than 500 sqft. By doing so, we try to pinpoint if the 1-bedder units are “underperforming” and dragging down the performance of condominium projects.

In this first chart (above), we look at the new sales performance of condominiums and apartments (henceforth Condos). We term this as the inflationary trend for new launches. As developers are price setters in the new launch market, the transacted price of new sales on the market captures the inflationary growth of new sale prices in some sense. When looking at these charts, we compare two things. First, the absolute psf difference between the comparison groups. Second, the growth rates between the comparison groups.
The absolute psf differences give us a form of a sanity check. For instance, we will expect freehold 1-Bedders to typically have a higher psf than non-freehold units (in this article we define freehold as including 999-year leasehold properties as well). Growth rates would be hard to consistently predict. That is more of a finding we hope to gain insight on. For the first said chart, the prices for new sales have grown substantially since 2007. While many cooling measures have been put into place since then, we take a bird’s eye view to see if there are any time-specific discrepancies.
The prices of 1-Bedders have grown considerably faster than larger unit sizes. 99-year Leasehold 1-Bedders have grown by 142% since 2007. Freehold 1-Bedders have grown 161% since 2007. Whereas, units larger than 500 sqft have grown an average of 97% since 2007. Your first thought might be that it is a good thing. If 1-Bedders are growing faster than larger units doesn’t that mean they are doing better? Not so fast. Having a higher new sale price for 1-Bedders ahead of their larger peers might mean that it is harder for buyers to exit at better prices. This is just a hypothesis, we will see how they do in the resale market later.
An important thing to note from the chart is that freehold 1-Bedders seem to be consistently priced above the larger units ever since 2008. However, 99-year Leasehold 1-Bedders seem to be priced with more volatility. There are some quarters where they outprice even the freehold 1-Bedders, and other quarters where they are priced even lower than the larger units.

Interestingly, despite the volatility of 99-year Leasehold 1-Bedders across projects, they perform quite consistently in the resale market. In fact, they have grown at a faster rate (197%) than even the freehold 1-Bedders (64%) since 2007. A possible reason for this might be that good freehold 1-Bedders are not released into the open market. The owners of good freehold 1-Bedders might not be willing to let go of their investments. As a result, only the investors with weaker hands or investments in less favourable locations let go of their freehold 1-Bedders. This might explain the lower growth rates of this group.
Other than that, both freehold 1-Bedders and larger units exhibited rather stable price trends. On the other hand 99-year leasehold 1-Bedders had more volatility between projects, mostly to the upside with some quarters (particularly 2012-2013) that exceeded the price range of freehold 1-Bedders. This sort of dispels our earlier concerns of capital appreciation. It seems that even if the inflationary trend for 99-year leasehold 1-Bedders is strong, investors can still make good capital appreciation gains despite buying at a high price.
A caveat here is that the observations we put out are based on the average trend. Not all projects would stand to gain from these price trends. However, based on the aggregate performance of smaller sized units, it would seem that they do not perform so poorly on capital appreciation than most would expect.
A Look at 2-Bedders
To move forward, let’s look at 2-Bedder Condos which we define as having between 500-750 sqft. Of course, this definition is not exactly the best. We look at this as a way to study the “larger” 1-Bedder Condos and the “smaller” 2-Bedder Condos. Based on the myth that we are busting, 2-Bedders should hypothetically do better in terms of capital appreciation than 1-Bedders.
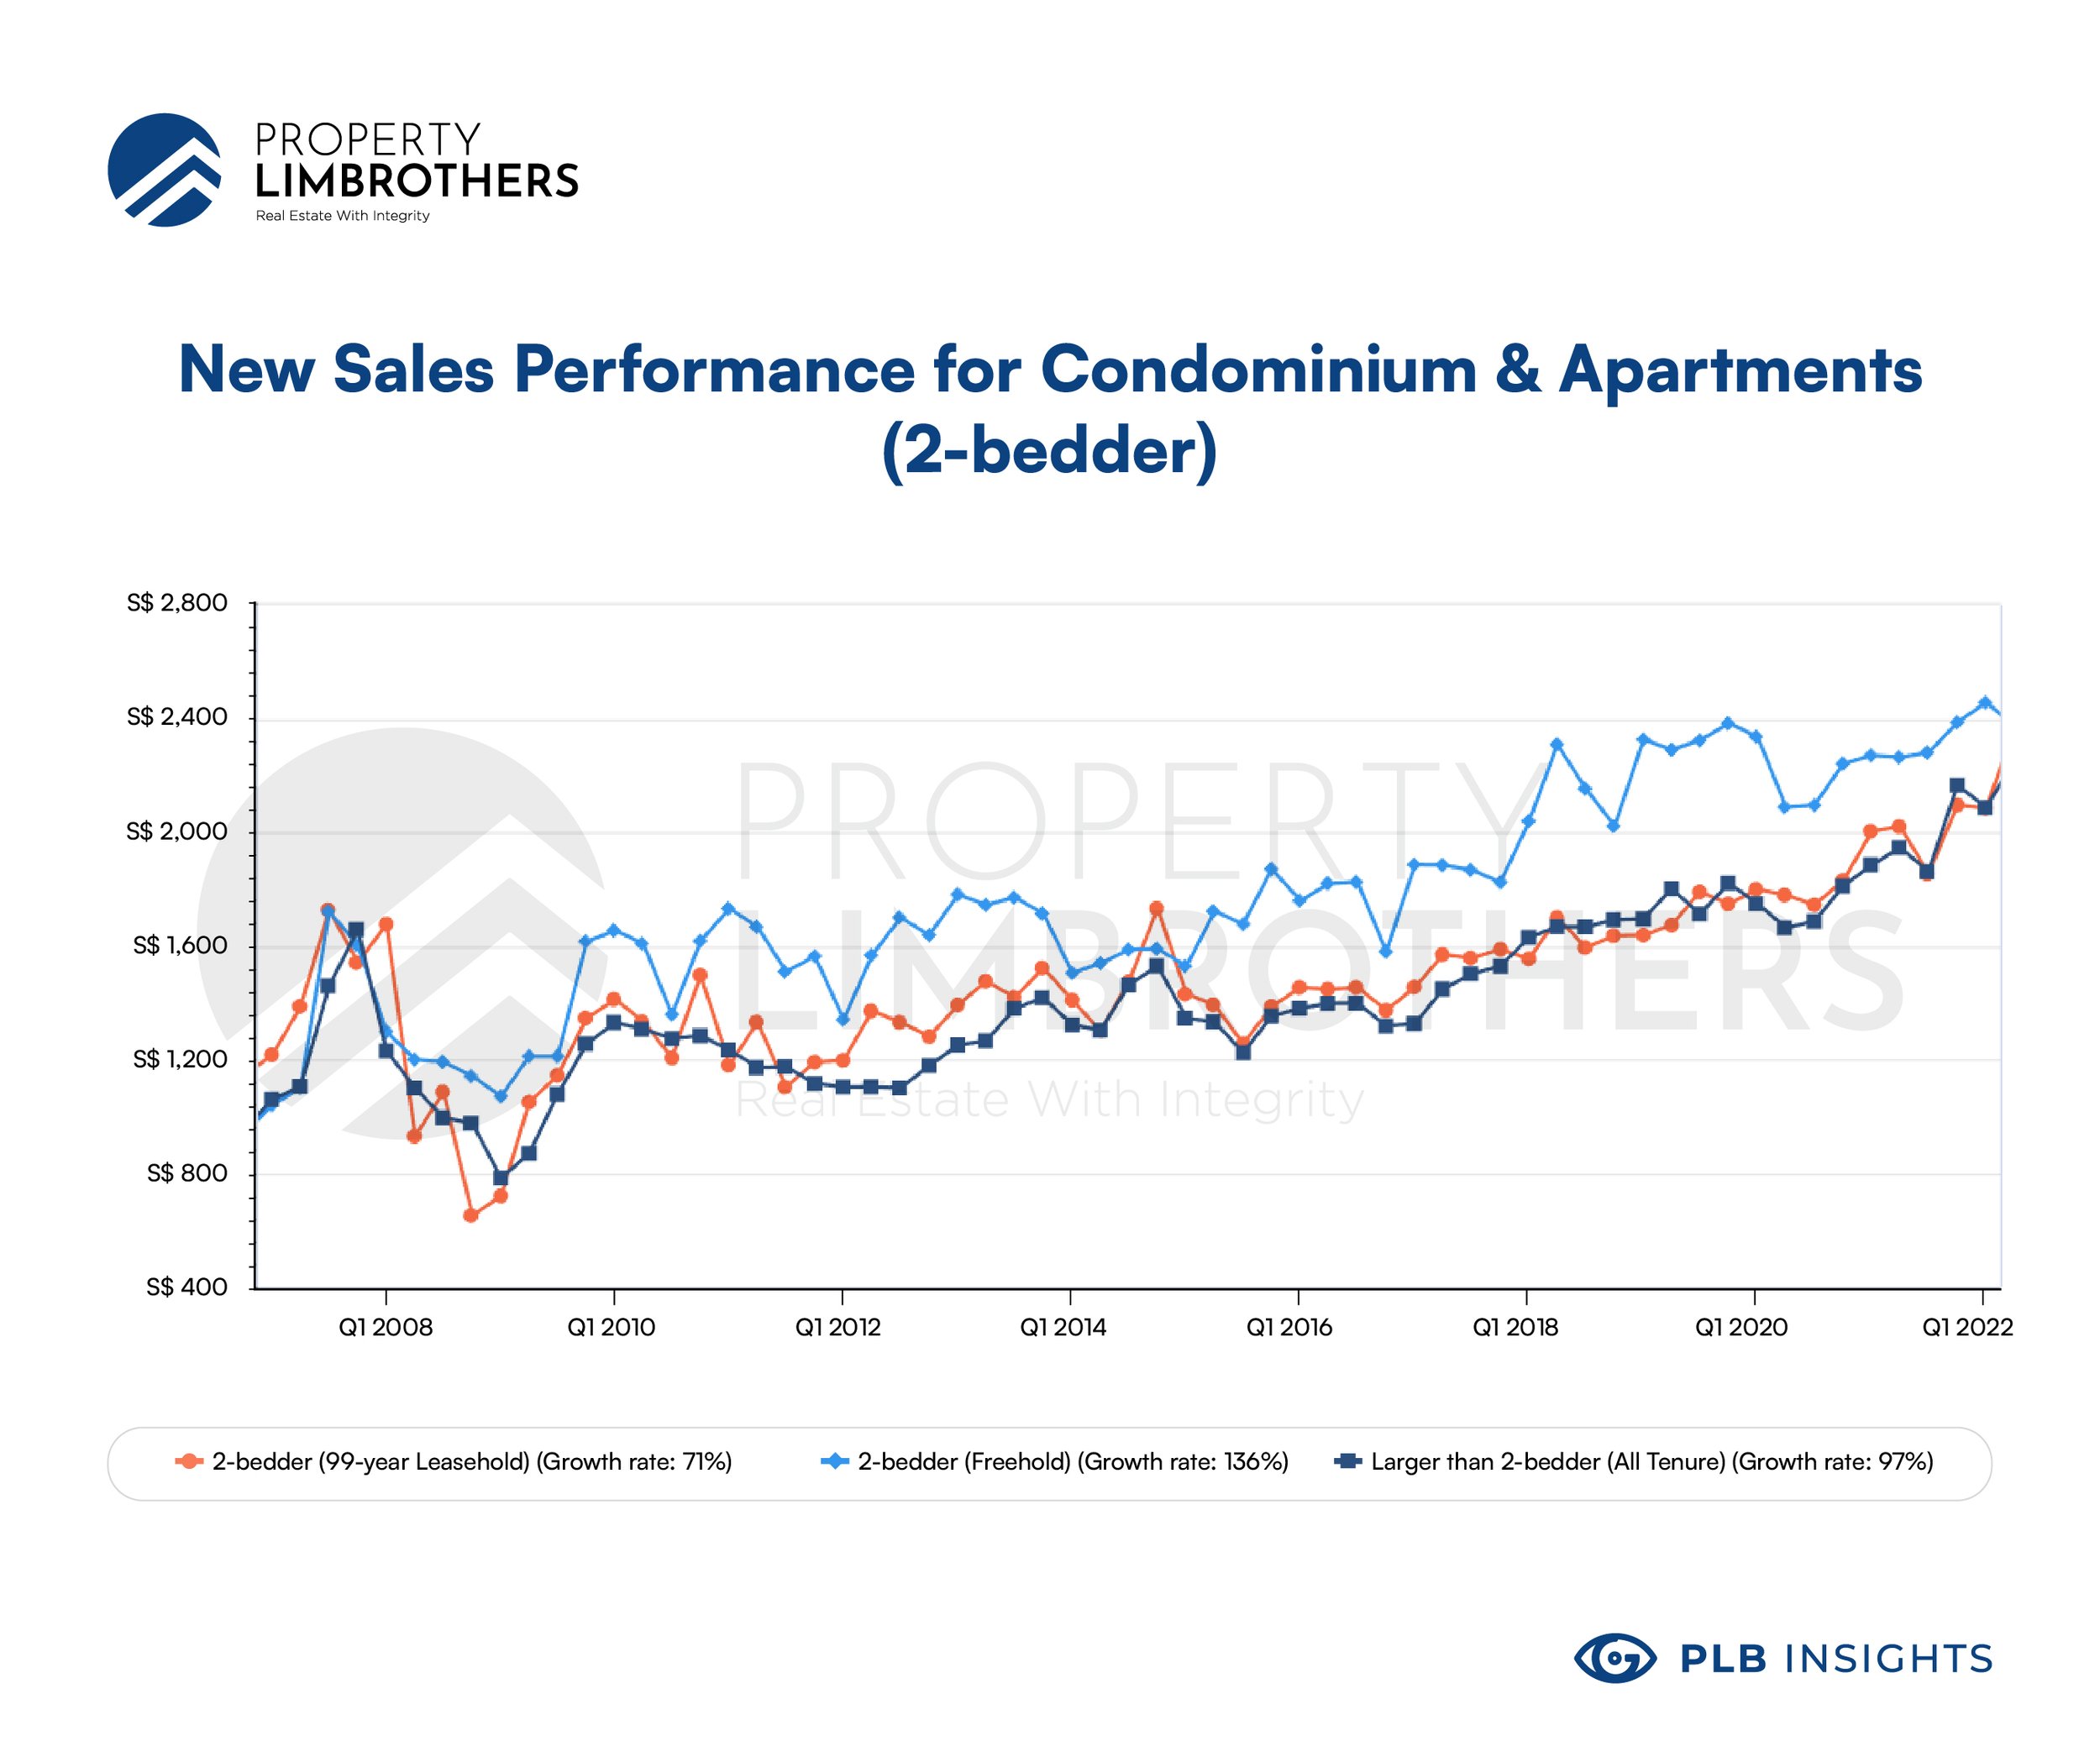
In the performance of new sales comparing just 2-Bedders and their larger alternatives, the freehold 2-Bedder option is priced the highest as intuition suggests. On the absolute psf basis and growth rate, freehold 2-Bedder options exhibit the strongest inflationary trend. We expect unit size to be positively correlated with the impact of freehold status on price. As families start to perceive the property more of a legacy rather than an investment the larger the unit is.
The performance of new sales for 2-Bedders follow rather closely to the larger options. However, the growth rate is marginally lower (26% over 15 years). This is not a huge number given the time horizon we are looking at. Compared to the 1-Bedder counterparts, 2-Bedders have grown considerably less in price for new sales. The new sale 99-year leasehold price for 1-Bedders grew approximately twice as much as 2-Bedders over the 15 year period (71% more). On the other hand, new sales for freehold 1-Bedders grew 25% more than 2-Bedders over a 15 year period. This is actually not a large number. The leasehold difference in price is more eye-catching.

For the resale performance of 2-Bedders, the same pattern emerges. Even though freehold prices grow more in new sales, 99-year leasehold prices grow more in the resale market. Now comparing between the 1-Bedder and 2-Bedders on the resale market, 99-year leasehold Condos have grown faster for 1-Bedders by a margin of 90%. However, freehold 2-Bedders have grown 4% more than their 1-Bedder counterparts. This has gone in line with the hypothesis so far. Indeed, the freehold status plays a stronger role the larger the Condo unit gets. On the other hand, for leasehold properties, 1-Bedders still perform strong despite higher inflation at the price point of new sales.

Looking at the comparison of 1-Bedder, 2-Bedder, and larger units on the same chart (above), we notice that both 1 and 2 Bedders are priced at a higher absolute psf, with 2-Bedders sometimes being priced higher. However, only 1-Bedders have much higher growth than larger units (197% compared to 112%). The 2-Bedder units have a marginally slower growth by 5%.
So far, the findings have shown that the capital appreciation for 1-Bedders is not poor. In fact, they are not pulling down the aggregate growth rate. What is more surprising is that in spite of having incredibly higher price points at new sales, 1-Bedders are still able to enjoy capital gains on the resale market upon exit. Perhaps, this effect can be attributed to the affordable quantums and a large pool of investors that are looking for rental yields rather than ownstay. We now look to the rental performance of 1-Bedders to see if they defy conventional expectations.

Rental Performance Comparison
For the rental performance comparison, we expect 1-Bedders to have a higher absolute rental psf than larger apartments. The idea is that smaller apartments are more “efficient” for the purposes of rent, thus generating a higher rental yield. The rental demand, in theory, is higher for smaller apartments due to a larger pool of renters that have not yet bought their own property or couldn’t afford to do so yet. Larger units tend to command a lower absolute rental psf. The growth rates in rental price reflect the elasticity of the rental demand from those specific demographics.

The chart above looks at the rental performance from Q1 2016 to the end of Q1 2022. In line with intuition, the larger the unit is, the lower the absolute rental psf it commands. Interestingly, however, 1-Bedders and 2-Bedders have the same growth rate of 3% over the past 6 years while larger units have grown 7%. This is rather modest growth. From the recent rental growth trajectory we highlight in the PLB Q1 Report, we expect rental prices to continue to grow strongly over the next few quarters. The higher growth for larger units might be due to changes due to the pandemic and work-from-home trends. The need for more personal space for living and work might be what have motivated the higher rental growth for larger units.
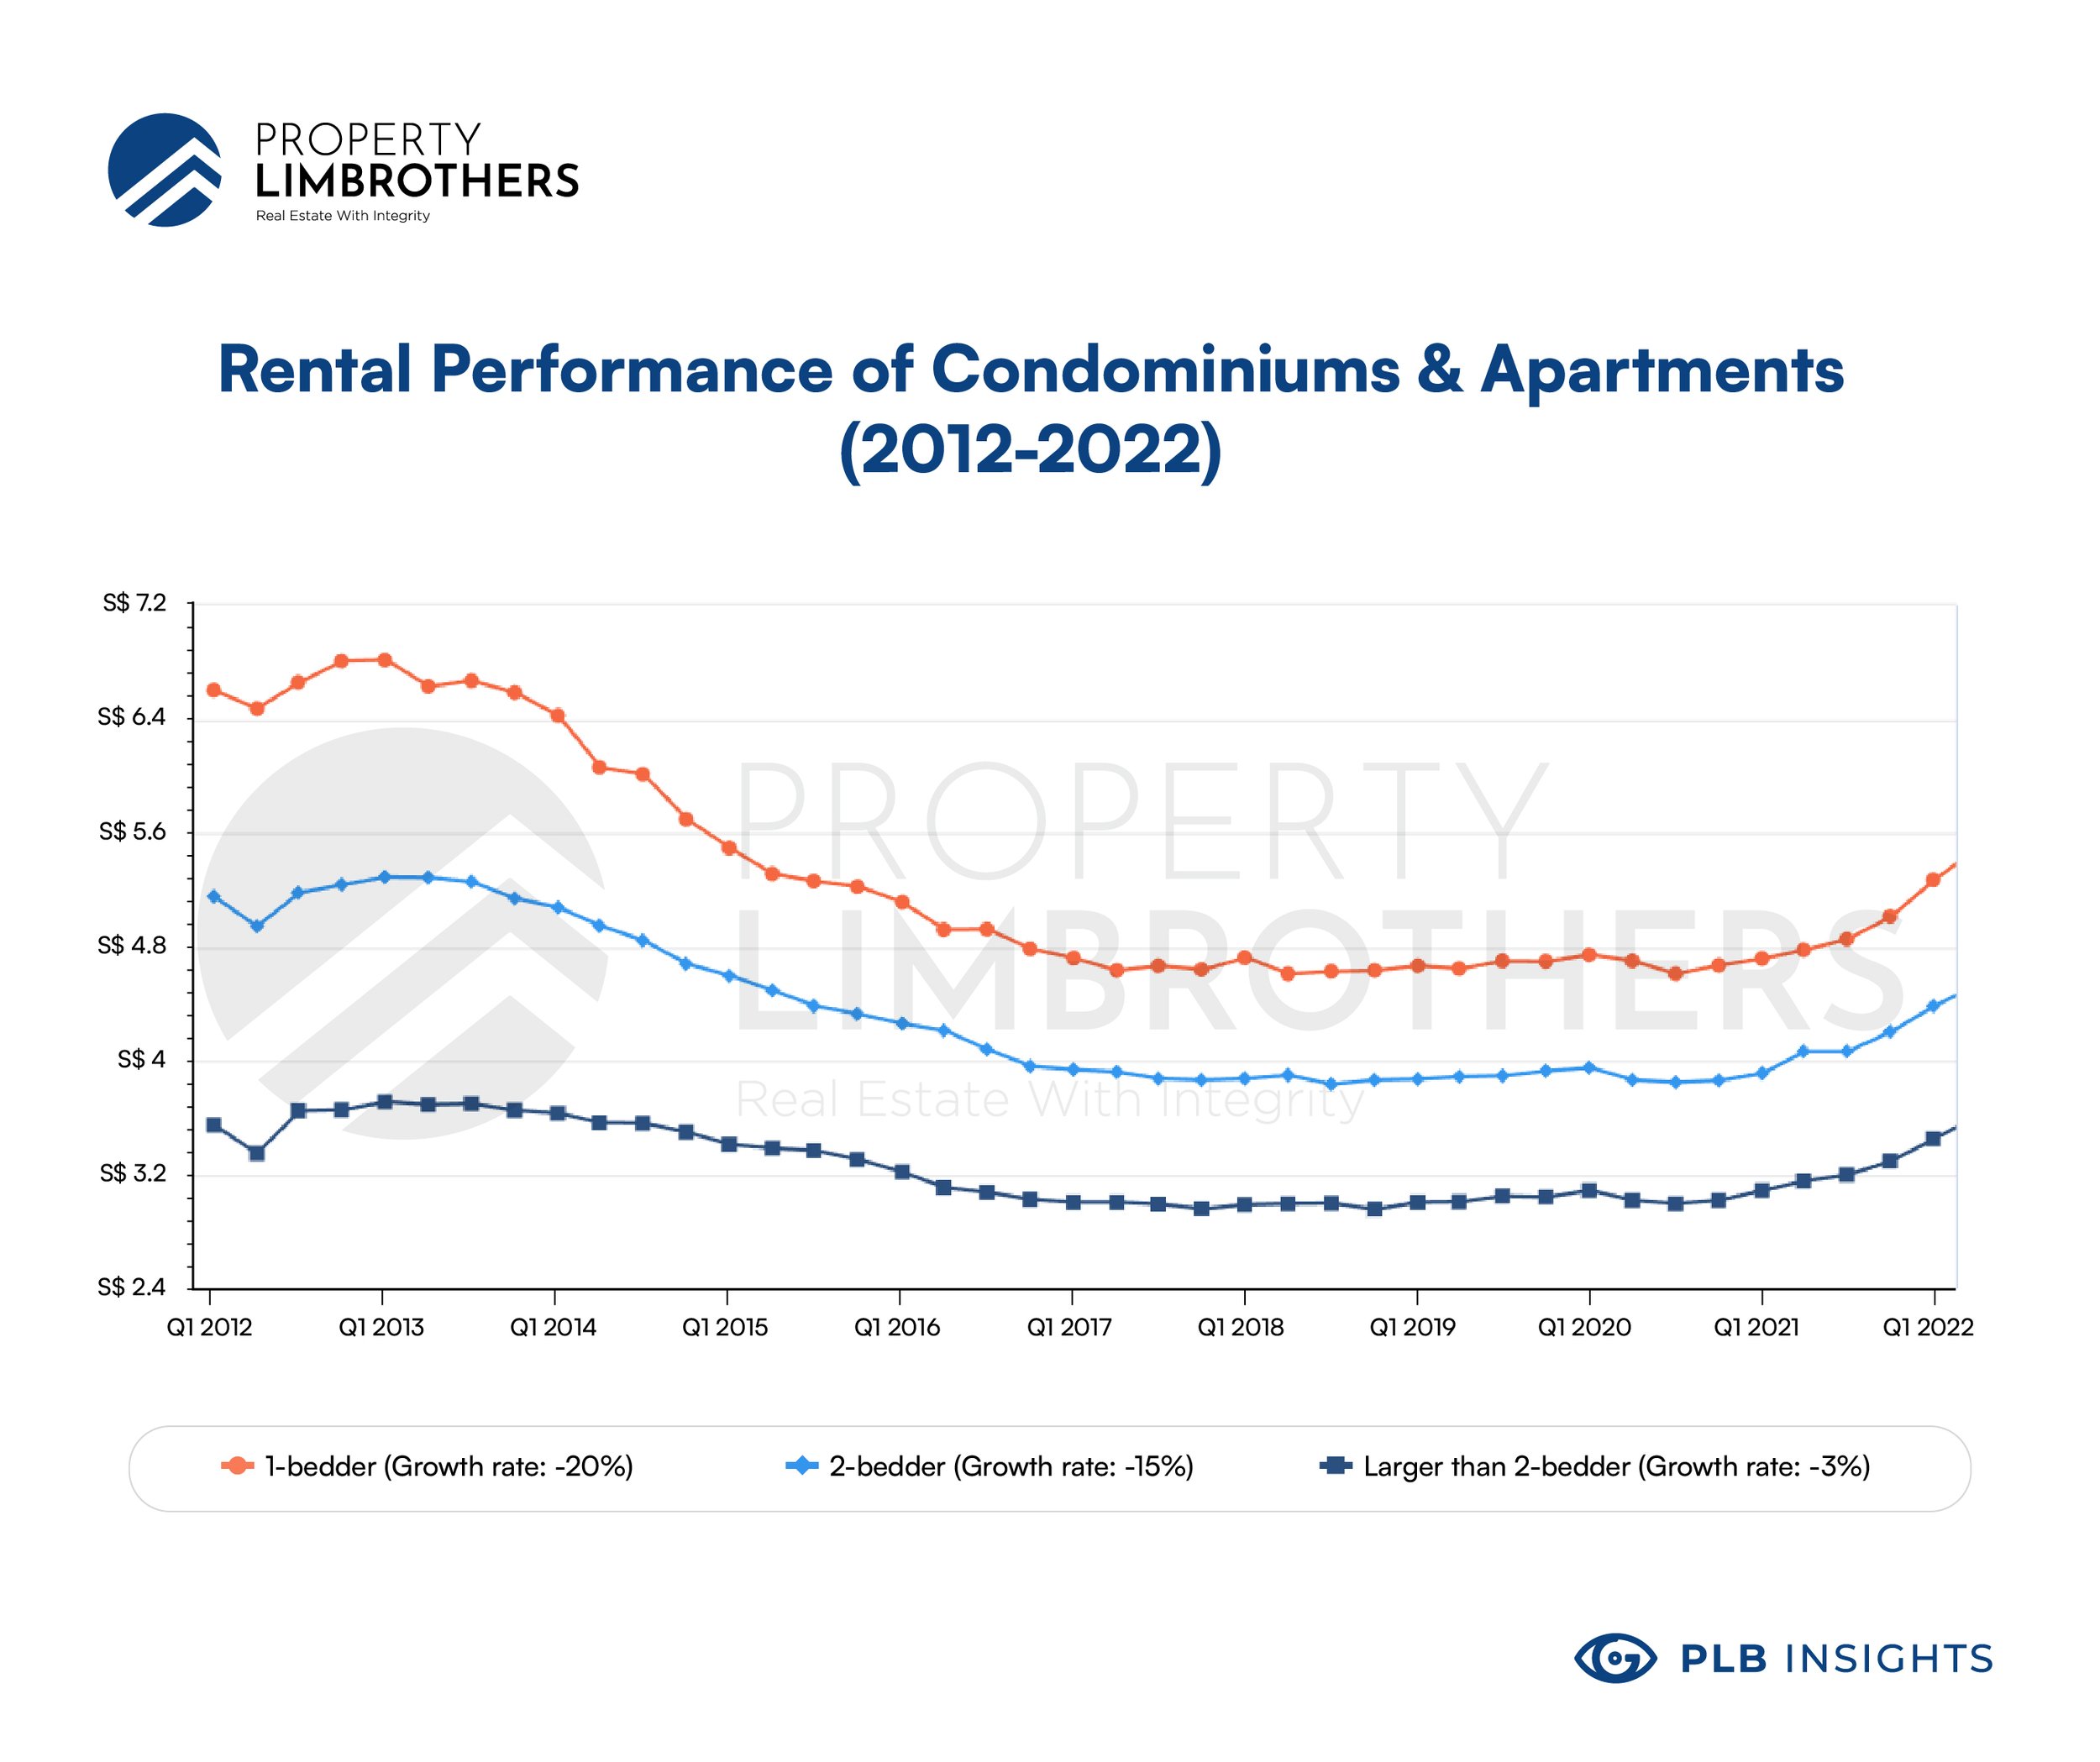
The story gets more interesting (and complete) as we zoom out even further. Looking at the rental performance since 2012, we notice this huge dip and deceleration in rental prices. Likely due to waves of cooling measures, preventing the rental market from reaching unaffordable levels. Many properties then (2013-2016) likely competed to get a desirable tenant. As the market now shifts from a tenant to a landlord’s market, we might expect rental prices to hit its previous all-time-high in a year or two unless there is government intervention in the rental market.
The important point to note is that price decelerates most sharply for 1-Bedder units (-20% over 10 years) as compared to 2-Bedder units (-15% over 10 years) and larger units (-3% over 10 years). Although the absolute rental psf for 1-Bedder remains the highest throughout the years, the growth rate is the one that is most strongly impacted.
To summarise, the absolute rental prices still fall in line with standard expectations. However, the growth rates are more negatively impacted the smaller the unit is. One possible reason to explain this is that 1-Bedders already command the highest absolute rental psf. Because of this, rental prices might fall faster than they grow.
Re-Contextualising 1-Bedders on the Ground
To re-contextualise what we have found so far on 1-Bedders, the ground sentiment from 2017-2022 was that smaller apartments have been gradually becoming much more difficult to sell. While new sale and resale prices have increased, it has become more difficult to exit. This translates to a longer time to exit. It takes more time to find a suitable buyer for the 1-Bedder unit.
The myth of 1-Bedders being worse investments than larger units are driven by stories of the market overflowing with resale 1-Bedders that cannot sell. This stems from HDB upgraders adopting the decoupling strategy of buying a 1-Bedder Condo as an investment property over the past few years.
Stories on the ground from real estate agents paint a picture of exit problems. When a 1-Bedder listing is obtained, many find it difficult to get buyers to enquire and view the place. While finding tenants for 1-Bedders might not be a challenge, exit in the resale market is tough. Of course, these stories come from the industry in general. We still believe that there is an audience for every home. That means that even when the going gets tough, it only means we need laser sharp focus to find the buyers that really benefit from, and see the appeal of the property.
To make our final comparison, we categorise 750 – 1200 sqft units as 3-Bedders and 1200 sqft units and above as 4 to 5-Bedders. We first make this comparison for the 99-year leasehold market and then the freehold market for resale Condos.

In this more recent trend, there is some truth in the resale performance of 99-year leasehold 1-Bedders. While it does marginally worse than 4/5-Bedders (2% over 5 years), it performs marginally better than 3-Bedders (2% over 5 years). The absolute psf is much higher for 1-Bedder units. An important thing to note here is that 1-Bedder units have more pronounced peaks. This translates to higher upside volatility, but may be specific to more expensive projects being sold. Overall, the price performance here does not definitively indicate that 1-Bedders perform poorer than larger units.
We now look at the changes in volume performance of 99-year leasehold 1-Bedders against larger units. The horror stories from real estate agents of not being able to exit could be seen from the small orange bars from 2017 Q1 till the pandemic in 2020 Q2. However, this trend broke in Q3 of 2020, launching resale volume for 1-Bedders to double from 40 over to 90 over. This peaked in Q3 of 2021, where resale volume for 1-Bedders tripled from before the pandemic to 157. 2021 Q4 hit an even higher number of transactions at 173 units.

Although the horror stories may have stuck in the minds of some real estate agents and investors, times now are different. We see strong volume performance after the pandemic to now. An additional fact to drop here is that the volume of transactions for 4/5-Bedders were marginally higher than 3-Bedders before the pandemic. However, after the pandemic, we see that transaction volume of 3-Bedders have surpassed that of larger units.
This might be due to the rising price of homes. Post-pandemic Singapore has seen its property market doing stellar. Prices have increased steadily. However, wage growth might have had issues catching up. As a result, relatively smaller options are now more affordable in comparison to larger ones. That might be why we see the volume of 3-Bedders surpass that of 4/5-Bedders. If this trend persists, we will see 2-Bedders and 3-Bedders gain more popularity in the coming years.
The caveat here is that the economy is facing some serious recessionary concerns in 2022 Q2. We can already see the volume shrink substantially in 2022 Q1. We expect the volume to continue shrinking as buyers hold back on making big ticket purchases during a period of economic slowdown. However, we expect prices to hold firm as current homeowners and investors likely have strong holding power and an unwillingness to let go of their properties at a lower price.

For the freehold version of this story, we see that the horror stories are more warranted to some degree. The performance of freehold 1-Bedders are substantially poorer than larger units (-2% over 5 years vs 11% for 3-Bedders and 19% for 4/5-Bedders). We see a peak in prices in late 2017 and early 2019. However, prices have not quite recovered for freehold 1-Bedders since. We attribute this poorer performance of freehold 1-Bedders, to boutique developments with a small project size (lesser units, hence lower valuations) which typically consists of lofts in the RCR area. These smaller apartments fit the stereotype of having better rental yield at the expense of capital gains.

For the volume performance, freehold properties seem to keep a stable equilibrium. 4/5-Bedders consistently have the highest transaction volume. Unlike the 99-year leasehold chart which showed a post-pandemic boom for 3-Bedder transactions. Volume in general did shrink in the period from Q4 2018 to Q2 2020.
Closing Thoughts
Coming back to our original question, do 1-Bedders perform worse than larger units? We found some interesting results. 1-Bedders which are 99-year leasehold tend to perform better. Though the freehold alternatives are typically priced higher on the absolute psf, they only grow faster in the new sale market. When 1-Bedders eventually hit the resale market to exit, it is the 99-year leasehold 1-Bedders that do better.
The amazing thing about 1-Bedders from the data so far is that they are able to enjoy capital gains on the resale market despite having new sale prices inflate at an incredible rate. This dispels the myth that 1-Bedders perform worse than larger units on capital gains. In fact, 1-Bedders actually have appreciated much faster over the past 15 years than larger units.
Another interesting finding is that while 1-Bedders do generally command a higher rental psf than larger units, the growth rate for 1-Bedder rental prices are modest compared to the larger alternatives. Nonetheless, the absolute rental psf is still the highest among all the larger alternatives.
The caveat here is that the myth only holds true for freehold 1-Bedders in recent years. Which cover a smaller very particular population of all 1-Bedder units on the market. 99-year leasehold 1-Bedders are a different breed on their own and perform almost on par with their larger counterparts.
1-Bedders thus do not perform worse than larger units. If you wish to know more about finding the right investment property and get deep knowledge of how property investing works, reach out to our experts here for an appointment to aid you in your property journey.