Over the past decade, few forces have shaped Singapore’s private residential property market as profoundly as the Mass Rapid Transit (MRT) network. Beneath the surface of capital gains and PSF metrics lies a deeper structural transformation: one where connectivity has reshaped the spatial logic of value, redistributed investment appetite, and quietly redrew the socioeconomic geography of the island.
Between 2015 and 2025, Singapore’s MRT network grew significantly with the expansion of the Downtown Line (DTL), Thomson-East Coast Line (TEL), and early phases of the Jurong Region Line (JRL). These infrastructural shifts, though gradual, had a measurable impact on private non-landed residential prices, especially in districts previously regarded as peripheral or underutilised.
Drawing from comprehensive URA and PropertyGuru data across 28 districts, PLB Research analysed how median price per square foot (PSF) evolved across four distance bands from MRT stations: 0–200m, 200–500m, 500–800m, and >800m. The results are conclusive — MRT proximity is more than just a convenience, it actually acts as an asset multiplier.
The Decade in Numbers: MRT Proximity and Capital Appreciation
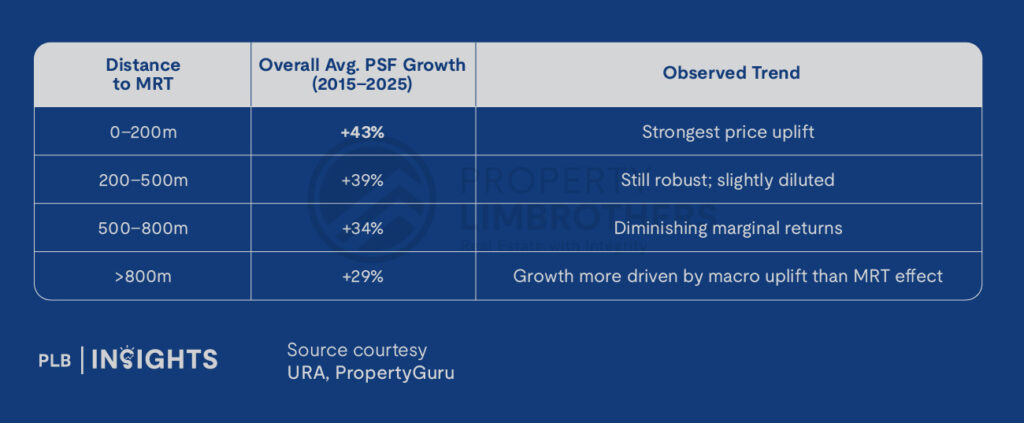
The correlation between proximity and price appreciation remained consistent across CCR, RCR, and OCR, albeit with different growth magnitudes and trajectories.
Spatial Redistribution of Value: From Core to Periphery
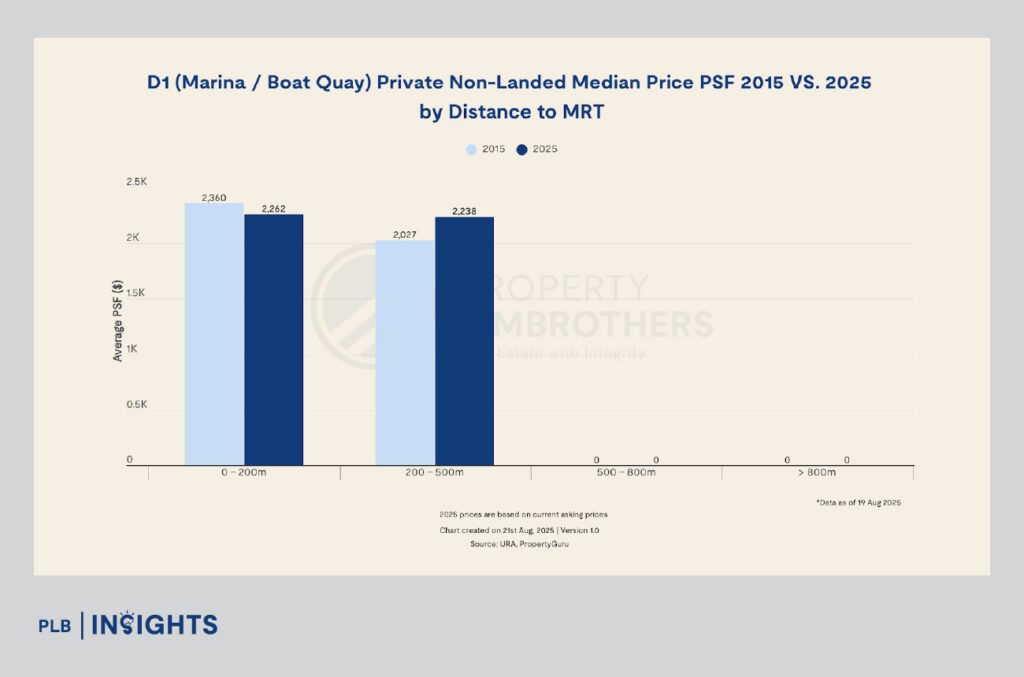
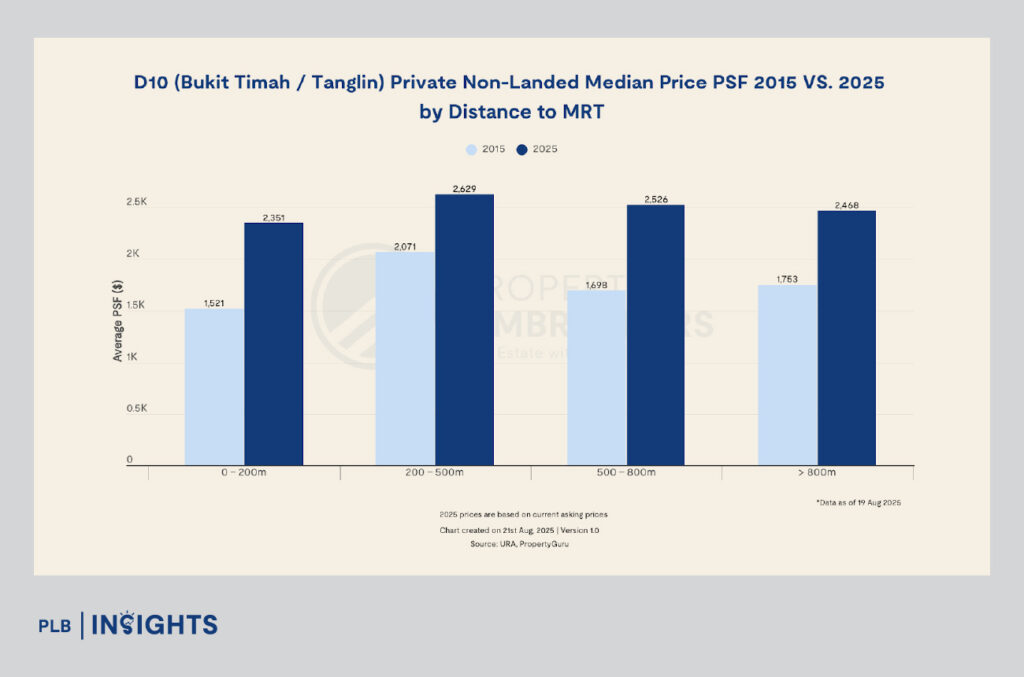
Core Central Region (CCR): Saturation and Stabilisation
Districts like Marina Bay (D1), Tanjong Pagar (D2), and Orchard (D9) saw stable but modest gains, with PSF growth near MRT stations averaging 10–25%. The MRT network in these areas has been mature since the early 2000s. Hence, the MRT effect has largely plateaued — future value growth is more likely driven by luxury positioning, redevelopment, and branding.


Rest of Central Region (RCR): The Convergence Zone
The RCR demonstrated the clearest MRT premium. Districts like Braddell (D13), Geylang (D14), and Amber Road (D15) saw PSF increases of 40–70% within 500m of MRT stations, vastly outperforming the islandwide average.
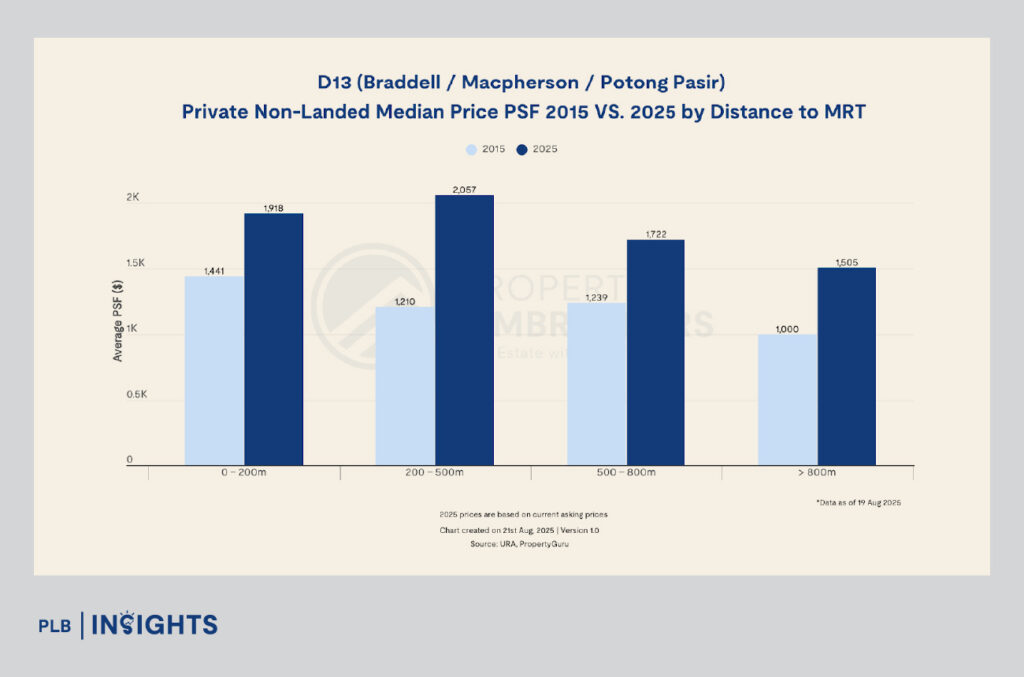


The RCR has reaped the positive effect of MRT investment and delivered maximum return on both capital and livability over the last 10 years.

Outside Central Region (OCR): MRT as a Catalyst for Transformation
Nowhere is the MRT effect more transformative than in the OCR. Districts previously considered “suburban” or “dormitory towns” emerged as high-growth zones due to MRT accessibility and government-backed rejuvenation.
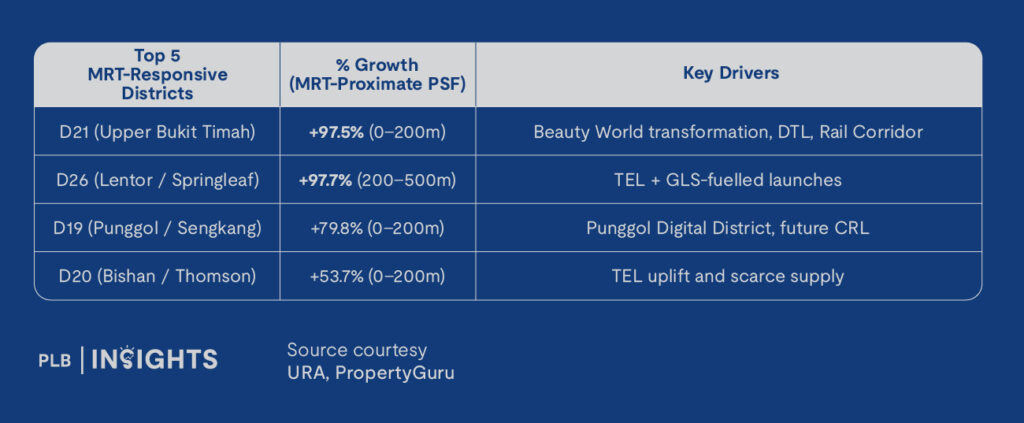
D21 – Upper Bukit Timah / Clementi Park / Ulu Pandan
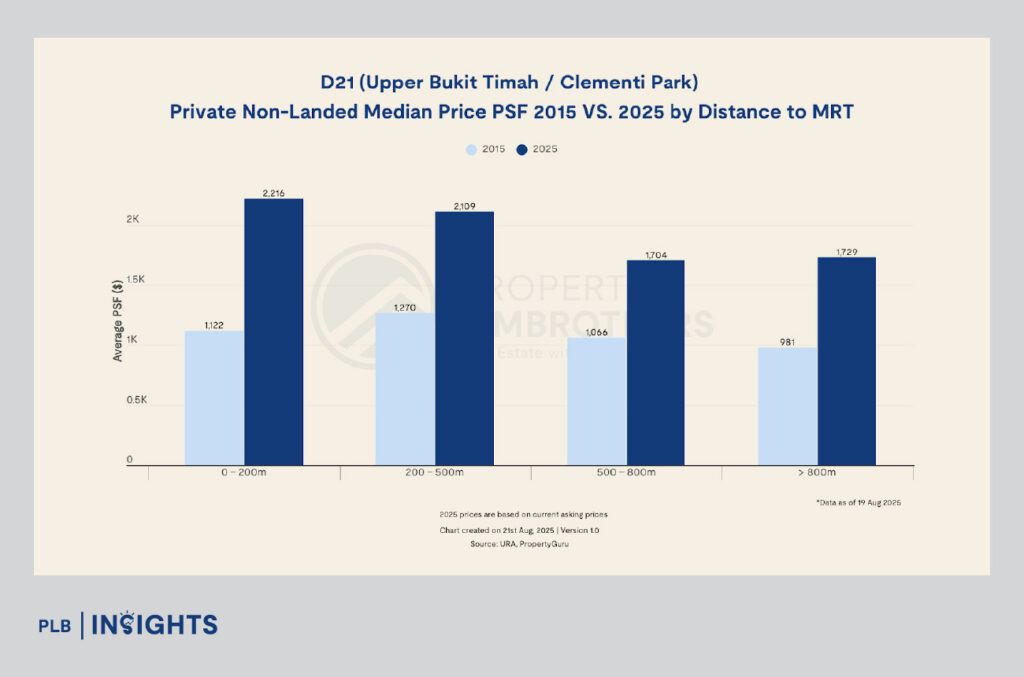
PSF Growth (0–200m MRT): +97.5%
2015 PSF: $1,096 → 2025 PSF: $2,216
Key MRT Lines: Downtown Line (DTL), future Cross Island Line (CRL)
Key Stations: Beauty World, King Albert Park
What was once seen as a fringe, low-density area bordering nature reserves is now one of the most vibrant growth stories in Singapore’s OCR. The Downtown Line extension in 2015–2016 brought MRT accessibility to a district previously underserved by rail. This single intervention had a cascading effect:
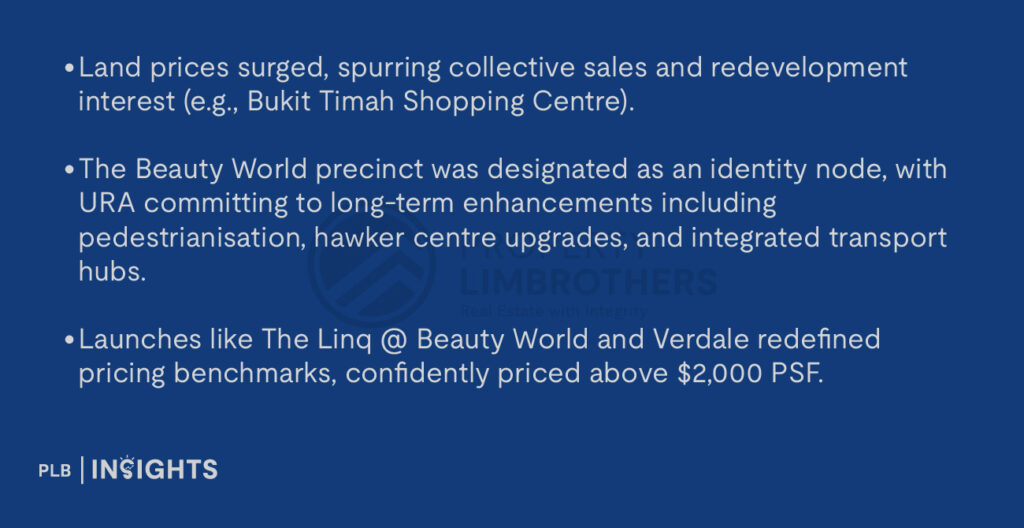
Implication: MRT turned D21 from a “value-for-money” district to a destination precinct, narrowing the perception gap with places like Holland Village (D10).
D26 – Springleaf / Lentor / Mandai / Upper Thomson
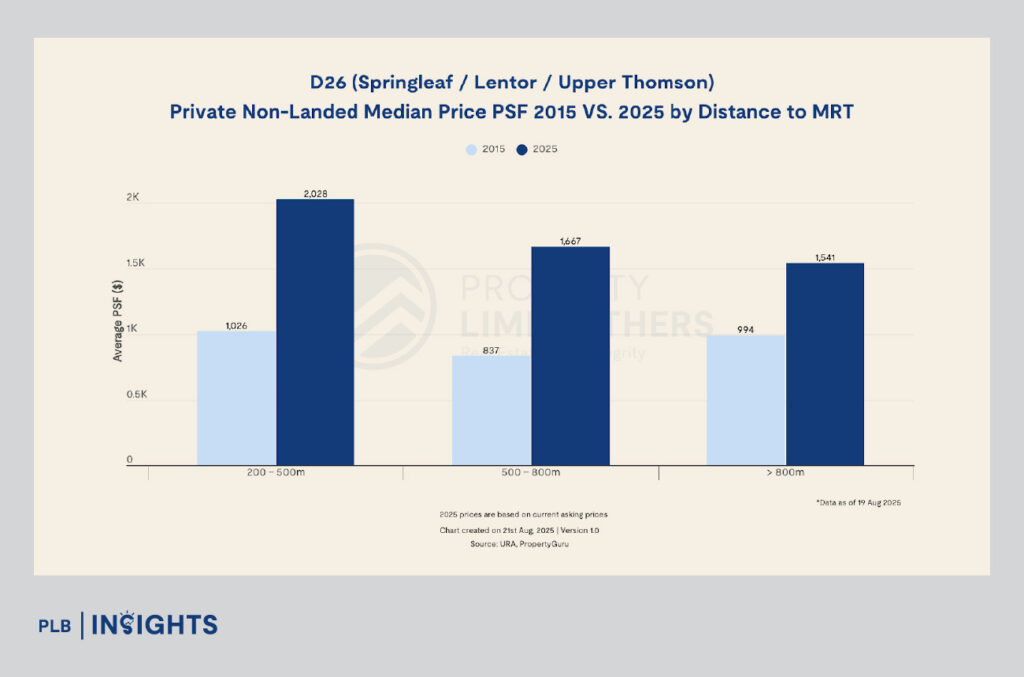
PSF Growth (200–500m MRT): +97.7%
2015 PSF: $1,026 → 2025 PSF: $2,028
Key MRT Lines: Thomson-East Coast Line (TEL)
Key Stations: Lentor, Mayflower, Springleaf
D26 is arguably the most transformed district of the past decade. Prior to the TEL rollout, Lentor and Springleaf were low-density, car-reliant enclaves dominated by landed housing and ageing condos.
The opening of Lentor MRT in 2021 was a turning point:
GLS land sales saw aggressive bidding as developers anticipated price uplift from connectivity.
Projects like Lentor Modern, Lentor Hills Residences, and others were launched between $1,900 to $2,300 PSF, a dramatic increase from historical norms.
The appeal of direct CBD and Orchard access without transfers via TEL made Lentor attractive to both upgraders and investors.
Implication: TEL brought D26 into the mainstream. What was once a peripheral planning zone is now a major investment corridor, with more MRT stations set to enhance accessibility further.
D19 – Hougang / Punggol / Sengkang
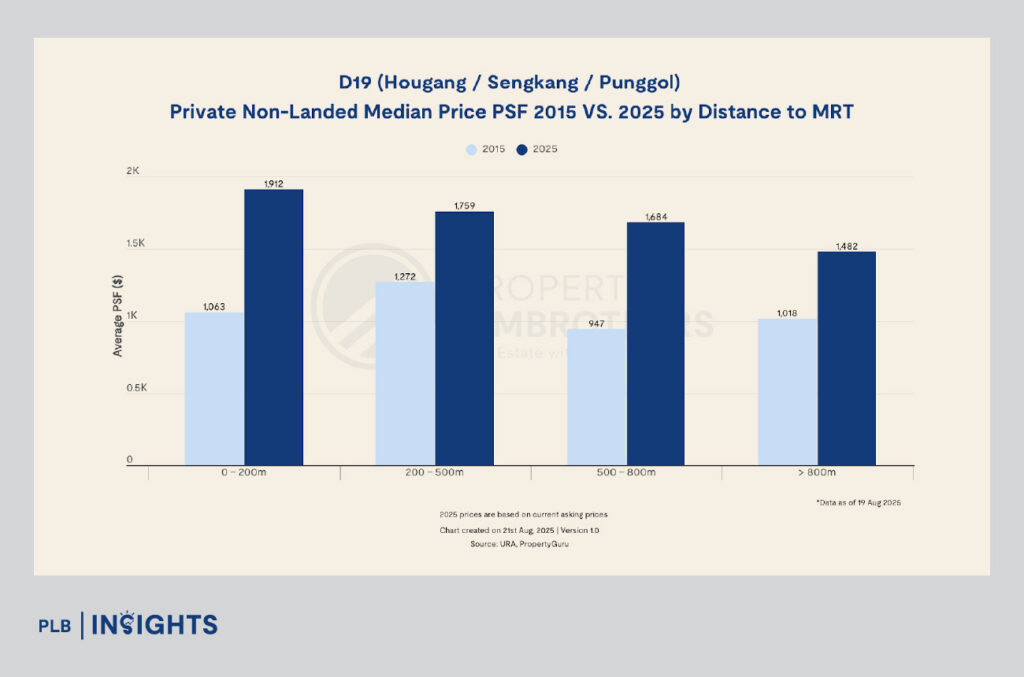
PSF Growth (0–200m MRT): +79.9%
2015 PSF: $1,063 → 2025 PSF: $1,912
Key MRT Lines: North East Line (NEL), Cross Island Line (CRL)
Key Stations: Hougang, Buangkok, Sengkang, Punggol
D19 has long been seen as a high-supply, HDB-dominant town, but in the past 10 years, it evolved into a mixed-use live-work-play hub, with MRT acting as the backbone.
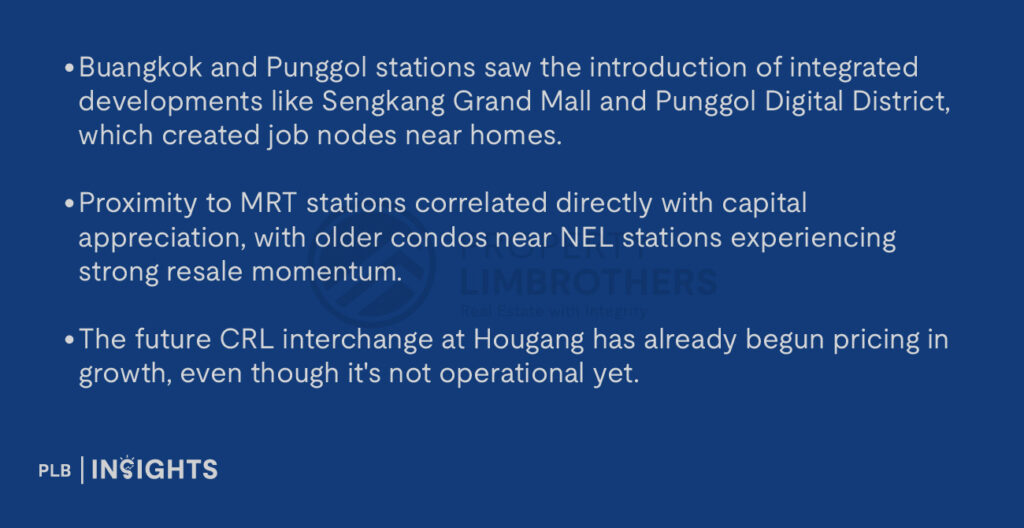
Implication: The MRT catalysed placemaking and densification in D19. It evolved from a commuter town into an increasingly self-sustaining urban cluster.
D20 – Bishan / Ang Mo Kio / Thomson
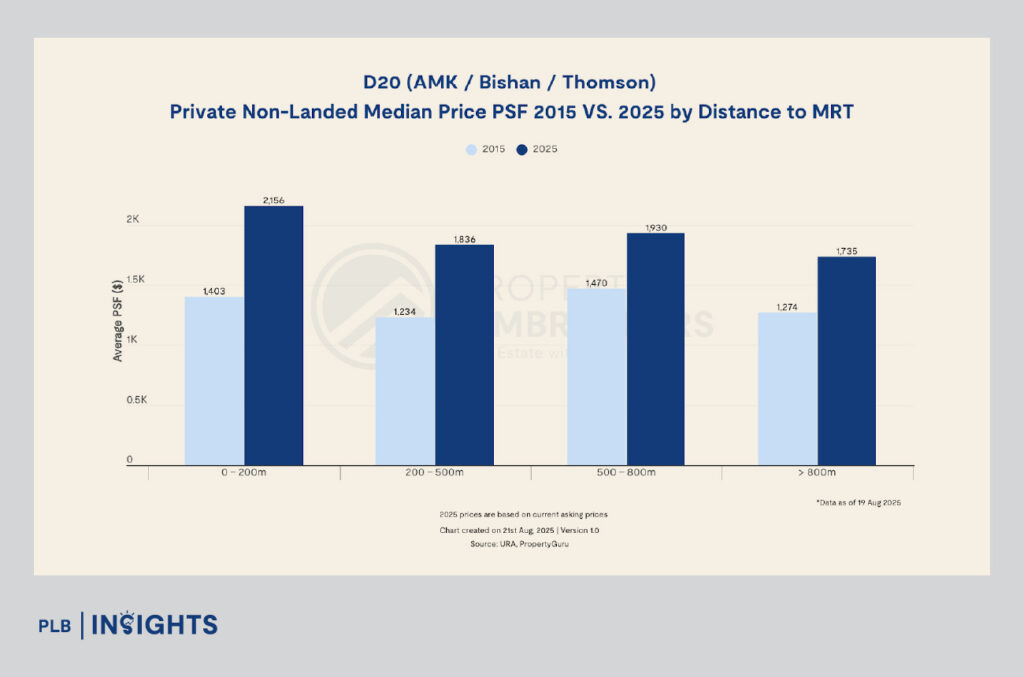
PSF Growth (0–200m MRT): +53.7%
2015 PSF: $1,403 → 2025 PSF: $2,156
Key MRT Lines: North-South Line (NSL), Thomson-East Coast Line (TEL)
Key Stations: Bishan, Ang Mo Kio, Bright Hill, Upper Thomson
As a mature town, D20 had already enjoyed decent connectivity via NSL. However, the introduction of TEL stations (Upper Thomson, Bright Hill) created a second wave of price escalation — especially in precincts like Sin Ming and Upper Thomson Road.
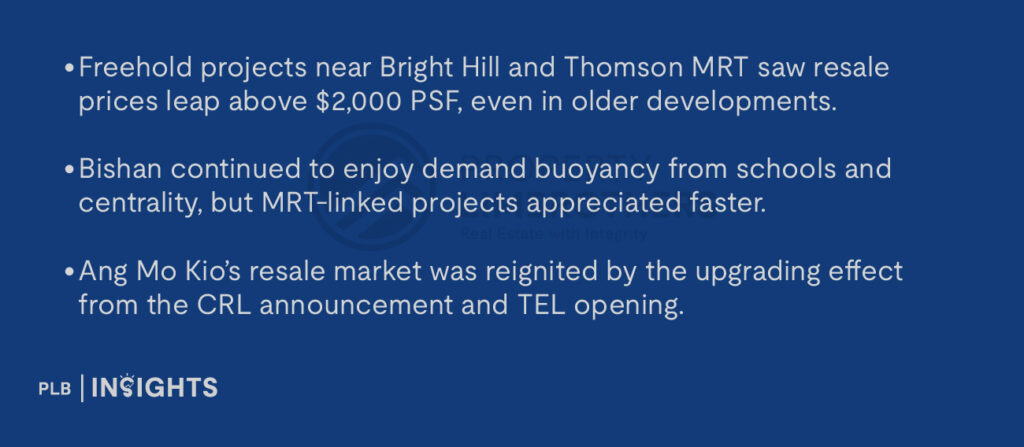
Implication: D20 showed that MRT accessibility can renew mature districts, lifting even older resale projects and providing a platform for new launch confidence.
PLB’s MOAT Analysis: MRT Effect
Under PLB MOAT Analysis, the MRT effect measures the distance between the project and the nearest MRT station. The nearer the project is to the station, the higher the project scores in this MOAT. Based on historical performance and market data from 2015 to 2025 above, there is clear evidence that projects located within 500 metres of MRT stations consistently outperform those located further away.
Distance Decay Curve: The Marginal Impact of MRT Proximity
Another significant finding is also the distance decay effect — the further a property is from an MRT station, the lower its PSF appreciation over the decade.
MRT Distance Bands vs. Price Elasticity (Example: National Average)
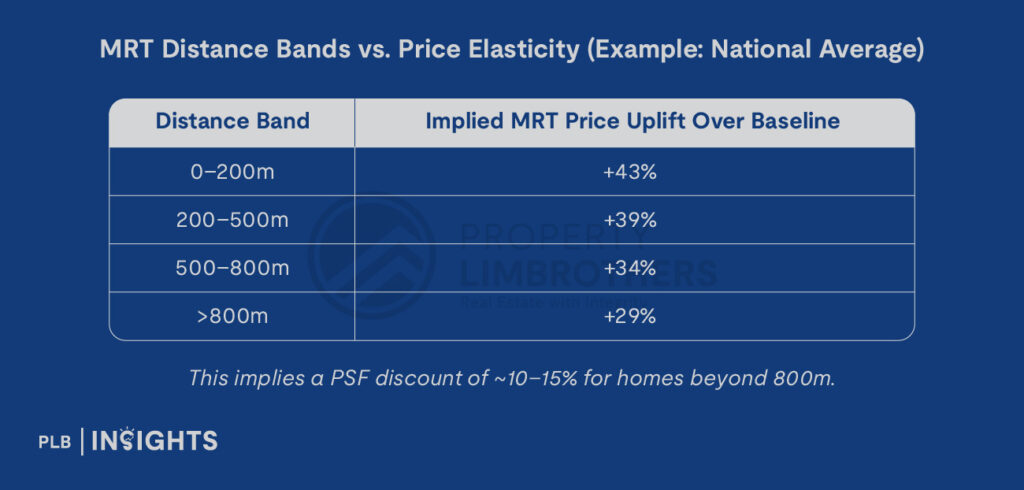
This implies a PSF discount of ~10–15% for homes beyond 800m.
What Drives the Decay? Deconstructing the Curve
Psychological Thresholds
In Singapore’s context, 400m is the mental benchmark for “true walkability.” Anything beyond 8–10 minutes on foot is often perceived as inconvenient — especially for families, elderly residents, and renters without vehicles.
Accessibility Elasticity
The marginal utility of access declines with each concentric ring. A buyer may be willing to pay significantly more to be <200m from MRT, but not proportionally more to go from 800m to 600m.
Land Use & Planning Policy Effects
URA and LTA prioritise higher plot ratios and mixed-use zoning within 400m–600m of MRT nodes. This leads to a denser concentration of amenities, better integration with malls, schools, and transport hubs — reinforcing the value premium.
Rental Market Preferences
Renters, particularly expats and working professionals, heavily favour MRT adjacency, translating into higher yields and faster leasing for landlords — which in turn supports resale values.
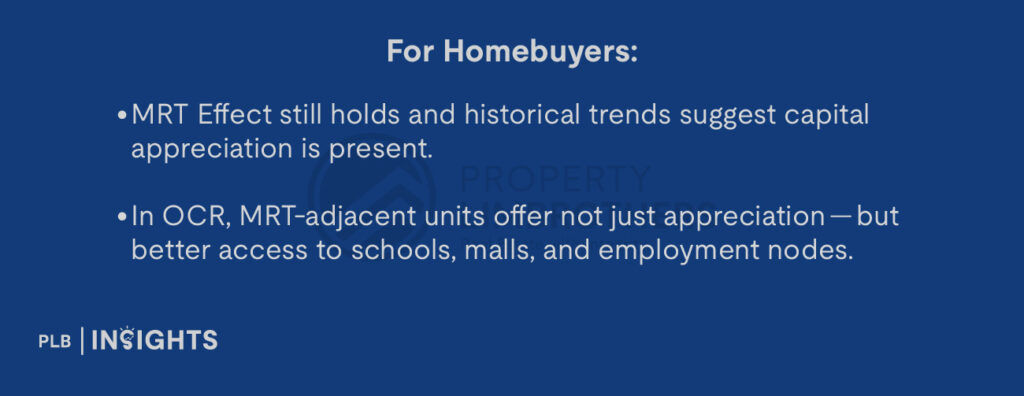
Implications for Stakeholders

Looking Forward: What Will 2025–2035 Bring?
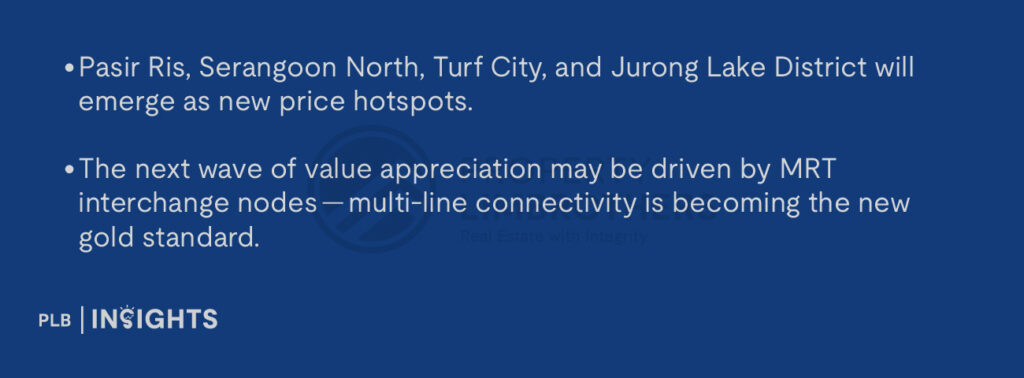
The next decade will likely amplify these dynamics. The full rollout of the Cross Island Line, Jurong Region Line, and extensions of the TEL will open up new pockets of value:
Final Thoughts
The past ten years provide irrefutable evidence: MRT proximity is one of the most powerful value drivers in Singapore’s property market. It’s not merely a lifestyle factor — it is an investment thesis, a planning doctrine, and a competitive advantage.
As Singapore moves toward a car-lite, 45-minute city model, the distance to an MRT station may well become the most important variable in real estate valuation. The decade from 2015 to 2025 has drawn a map of winners. The next decade will draw the next one — likely along the tracks still being laid.
For detailed price growth data across the remaining districts, you may visit www.disparityeffect.com.
Stay Updated and Let’s Get In Touch
Unsure how these trends apply to your home or investment? Connect with our consultants now to get strategic, data-backed guidance.
Disclaimer: Information provided on this website is general in nature and does not constitute financial advice
PropertyLimBrothers will endeavour to update the website as needed. However, information may change without notice and we do not guarantee the accuracy of information on the website, including information provided by third parties, at any particular time. While every effort has been made that the information provided is accurate, individuals must not rely on this information to make a financial or investment decision. Before making any, we recommend you consult a financial planner or your bank to take into account your particular financial situation and individual needs. PropertyLimBrothers does not give any warranty as to the accuracy, reliability or completeness of information which is contained in this website. Except insofar as any liability under statute cannot be executed, PropertyLimBrothers, its employees do not accept any liability for any error or omission on this website or for any resulting loss or damage suffered by the recipient or any other person.

