What is a buyer’s biggest dilemma when looking for a property that fits their needs? For a “simple” property purchase, residents have many decision factors to take into consideration. Soon, the problem expands into something that is difficult to manage. Do you know whether you’re making the right decision? What if there is a better condo out there that fits your criteria? What if there are certain factors that you did not consider before?
The MOAT Analysis looks at 10 specific aspects of properties that are related to their present and future value. We examine the Volume Effect, Region Disparity Effect, Rental Demand, Quantum Effect, Parents Attraction Effect, MRT Effect, Exit Audience, District Disparity Effect, Landsize Density Effect, and Bala’s Curve Effect.
PLB made the MOAT Analysis tool to make property search and comparison much more efficient and effective. It has helped countless clients of ours compare and shortlist properties at a glance, speeding up the decision-making process. This has also helped reduce the stress of manually comparing multiple properties in a disorganised fashion.
In this article, we will be specifically focusing on the District Disparity Effect. Why is such a factor important for buyers to take note of? We cover this with 3 sample properties as a simple comparison to contextualise how the MOAT Analysis can help you in your property search. Stay tuned as we dive deeper into PLB’s MOAT Analysis.
What is the District Disparity Effect?
The District Disparity Effect is almost as simple as the name suggests. It looks at the property you have selected, and pits it against the average psf of other properties in the same district. This is an approximation of where the property stands in terms of its pricing premium. In some sense, you can use this to help guide whether you are overpaying for a certain property or if there is some extra value in your selection.
However, not all districts are made the same. Some districts cover a larger geographical area than others. As a result, you might find greater variation in the psf of properties in that district. That is why you also have to consider the actual distribution of property prices within the district. This is an important caveat to keep in mind when using this trait to compare between properties of different districts.
The disparity that we are referring to is the price difference between the district average psf and the selected property’s psf. We use this measure to gauge where the property falls within the larger pool of projects in its own respective district. This is especially important when you are considering properties in the same area.
When you do so, the disparity in a simple interpretation gives you what might be over, under, or fair-valued in the market depending on what properties you are comparing.
Why does the District Disparity Effect Matter?
So, why does this matter? The district disparity effect is an important price indicator to keep in mind. In pricier markets like the one we are experiencing now, high real estate prices will “price out” buyers from more expensive options. More buyers will be increasingly value-focused, and pay more attention to properties that are in the more affordable price range.
The District Disparity Effect is a great way to scan for such properties that are selling below the average psf of its district. Conversely, it can also be used to identify pricier properties to scan for locations that are good or are in demand as indicated by the price premiums. Subsequently, scanning for value-properties nearby might be a good play as priced-out buyers will look to these more affordable options.
Apart from the search and comparison process, the District Disparity Effect is important because it keeps users focused on value rather than absolute price. If capital appreciation and growth of the asset are important to you, then you should definitely pay more attention to value. Rather than comparing the absolute psf of projects, the District Disparity Effect allows you to make quick value comparisons between multiple properties (without you having to do all the maths).
Ultimately, the District Disparity Effect matters because it allows you to be growth-oriented and better equips you to search for and capture properties that have the potential to appreciate and grow due to their undervalued status.
District Disparity Effect Analysis in Action
Now, let’s dive into the application of how we compare and analyse using the District Disparity Effect. For the purposes of demonstrating the District Disparity Effect at work, we have chosen to compare Inz Residence, Bartley Residence, and Amaranda Gardens.
A quick look at the MOAT Chart tells us that the three projects are starkly different. Each of them has its strengths and weaknesses. And the MOAT Analysis allows us to identify them all at a glance. Needless to say, this makes comparing multiple projects a breeze.

Now onto the information about Inz Residence. This executive condominium is found in District 23, Choa Chu Kang. Hitting a total number of 497 units, this 99-year leasehold development started its lease in 2015 and was completed recently in 2019. The MOAT Chart below neatly summarises what we need to know about Inz Residence on a deeper level.

Inz Residence scored the highest, at 76% on our MOAT Analysis. It did brilliantly for Bala’s Curve Effect because of its recently completed status. It scores just as well on Exit Audience and Quantum Effect as well, which means it caters largely to an HDB Upgrader profile and is also within an affordable range for most Singapore residents. More importantly, for the purposes of this analysis, it scores a 5/5 for Region Disparity Effect, and District Disparity Effect. This signals that Inz Residence has a psf which is below the average psf of the region (OCR) as well as the district (23).

Is Inz Residence a hidden gem then? Of course, this isn’t a straight-up buy recommendation. Clearly, executive condominiums stand to do well on the value scale due to their status as a form of hybrid subsidised housing. Over a longer time horizon, the privatisation of executive condominiums in their tenth year will help unlock the full value of the property.
Even before then, executive condominiums are still a popular alternative to other popular market options such as new condo launches or a conventional resale condo move. Undoubtedly, ECs excel for buyers as a value play, and the MOAT Analysis correctly reflects that. To bring this one step further, if you find a private condo that still scores a 5 on District Disparity Effect, it would be a more pronounced signal of value.
Yet, you would still have to do your research to make sure that the low price is not due to some inherent unattractive qualities of the property. The MOAT Analysis can help you check this blind spot using the overall score and scores on the other factors.


Bartley Residences is our second example for this demonstration. It is a private apartment in District 19, Serangoon. Its 99-year lease started in 2011 and was completed in 2015. It has a total number of 702 units and scores a high 72% on the MOAT Analysis.
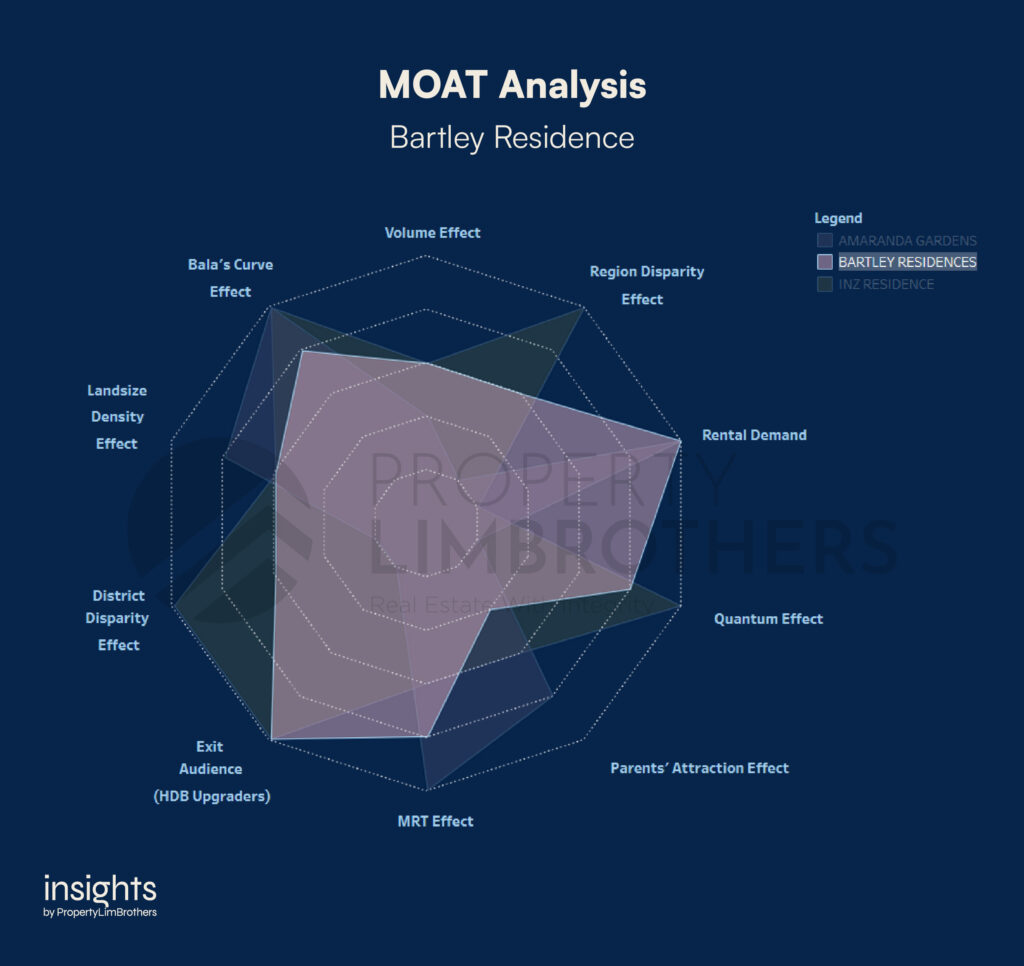
Bartley Residences is mostly an all-rounder in terms of its performance. However, it does well in Rental Demand and Exit Audience. In terms of where it sits for the question of value, it hits the middle ground for both Region Disparity Effect and the District Disparity Effect.
In other words, its price is very close to what you would expect from the average condo in the district. This is a signal to explore if the project has any outstanding features that appeal to you than the story of price. A middle score for these aspects of value is not a warning sign. Rather, your reasons for buying should be more strongly motivated by other factors. This might include the distance to your parents’ home, workplace, or simply that you like that neighbourhood more and would like to live there.

Value is an important factor, but it is not the be all and end all for property decisions as we will see in the Amaranda Gardens case.

Amaranda Gardens is another development found in District 19, Serangoon. However, it is different from Bartley Residences in the sense that it is a freehold condominium. It was completed in 2004 with a total of 189 units. With a total score of 58% on the MOAT Analysis, most people might miss out on what the property excels at.
Despite the deceptively lower MOAT score, the MRT Effect, Rental Demand, and Bala’s Curve Effect are a 5. The Parents’ Attraction Effect and Landsize Density Effect is a 4. Slowly, we start to see why Amaranda Gardens scores low on the Region Disparity Effect and the District Disparity Effect. The reason for the high price is because of the premium buyers pay for the freehold status, the closer vicinity to both Lorong Chuan and Serangoon MRT stations, and the walking distance to many more educational institutions such as Nanyang Junior College and St. Gabriel’s Primary School.
In other words, a low MOAT score for District Disparity Effect doesn’t necessarily mean that the property has no value. Rather, it is a signal for you to pay attention to what you are paying for. Sure, the property may be higher than the average price of properties in the district. But are you getting the benefits of paying more? And do these additional benefits matter to you?
These are important questions that are flagged up quickly at a glance using the MOAT Analysis. And this makes the search and comparison process for properties more robust, less superficial, and more effective for home buyers.
Closing Thoughts
Are you able to find out if the next property you are looking for is reasonably priced? The District Disparity Effect in our MOAT Analysis may just be able to help you find that answer. It is a key way to identify value in the district, and help you find out what features you’re paying a premium for even if it is on the pricier end.
The MOAT Analysis is versatile, flexible, and most importantly adds value to our clients in their home search journey. It makes the process more bulletproof and helps give buyers the confidence that the choice they have made is the right one. After all, this might be a multi-million dollar purchase we are talking about. There is never too much analysis on making such a move.